Geoscience Reference
In-Depth Information
The values of Table 4 are used globally. Monetary values are transformed for each
country with their price index. Brazil was taken as the price-reference country as de-
scribed in (Benítez et al., 2004) and (Obersteiner et al., 2006).
Table 4.
Global values.
Baseline
0.1
Decay rate long
ln(2)/20
Decay rate short
0.5
Factor carbon uptake
0.5
Frequency of incentives payment
5 years
tC to m3
4
Harvest losses
0.3
Hurdle
1.5
Maximum rotation interval
140 years
Minimum rotation interval
5 years
Planting costs
800 $/ha
Carbon price
0-50 $/tC
Carbon price incentives
0-50 $ftC
Minimum Land price
200 $/ha
Maximum Land price
900 $/ha
Minimum wood price
5$/ha
Maximum wood price
35$/ha
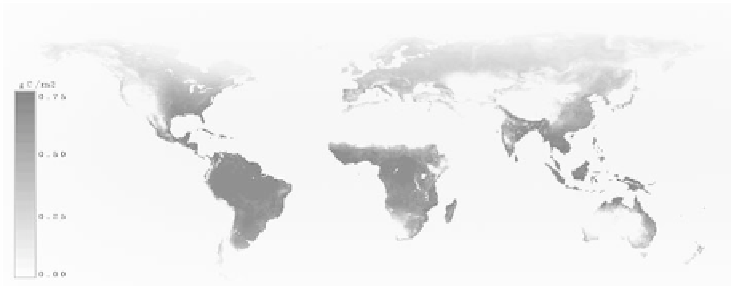
In Figure 1 the net primary productivity taken from (Alexandrov et al., 1999) is
shown. The values range up to 0.75 gC/m
2
/year. The highest productivity is near the
equator.
Figure 1.
Deforested Area until 2100. Deforested Area under alternative assumptions. Incentives...
periodic payments for standing biomass, Tax... payments for harvesting wood, Burn... felled wood
is burned immediately, Sell... harvested wood is sold, Burn/Sell... share of the wood will be burned
the other part sold.