Geoscience Reference
In-Depth Information
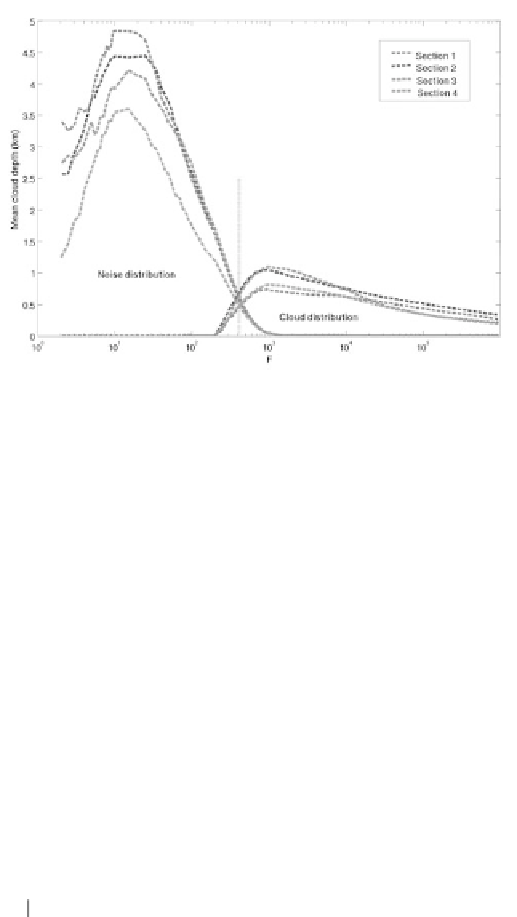
Figure 1.
Distributions of both the mean cloud geometric thickness and the signal noise against the
value of the threshold F for GLAS measurements. The Glas/ICESat data used for this study are from
October 13, 2003. Data are collected between 16:39 and 16:59 (GMT) for Section 1, 16:59 and
17:19 (GMT) for Section 2, 17:19 and 17:39 (GMT) for Section 3, and 18:20 and 18:40 (GMT) for
Section 4. Here, F has been assessed to be equal to 395, 441, 413, and 411, for respectively Sections
1, 2, 3, and 4.
Two distributions are thus retrieved; the fi rst is associated with the noise and the
second is associated with the scattering layers themselves. A value for
F
is inferred
from the intersection of these two distributions to minimize the error probability that
is a function of the no detection and false alarm probabilities (Chazette et al., 2001).
From all the structures identifi ed after the fi rst step of the algorithm, we further
discriminate between clouds and aerosols. However, this operation can be quite diffi -
cult for lidar data, primarily for the case of dust aerosol that is denoted by a low
Angstrom exponent (Grant et al, 1997). Different classifi cation approaches have been
suggested for GLAS (Palm et al., 2002) and CALIOP (Liu et al., 2004; Vaughan et al.,
2004) lidar profi les. We use the GLAS prototype algorithms to separate clouds and
aerosols in the LITE data processing between the ground level and the altitude of
8 km. The lidar signal is explained in term of the attenuated volume backscatter
coeffi cient
(Platt et al., 1998), that is, to the calibrated, range-corrected lidar
signals within each layer. The discriminator used here is based on the threshold relation
given by
P
()
'
β
r
X
.
β
max
is the maximum attenuated backscatter of the layer
= ′
β
Δ ′
β
/
Δ
z
max
>
max
and
z
max
is the maximum vertical gradient magnitude within the layer.
X
defi nes
the thresholds previously defi ned. Layers with values of
P
larger than
X
are interpreted
as cloud whereas the others are classifi ed as aerosol. After a statistical study, we deter-
mined the value of
X
to be 3.10
10
m
−3
.sr
−2
.
The altitude range of the resulting CTHs is classifi ed following the ISCCP app-
roach: low (L), middle (M), and high (H) clouds corresponding to pressure levels of
1,000-680 hPa, 680-440 hPa, and 440-50 hPa, respectively (Rossow and Schiffer,
1991).
Δ ′
β
/
Δ