Geoscience Reference
In-Depth Information
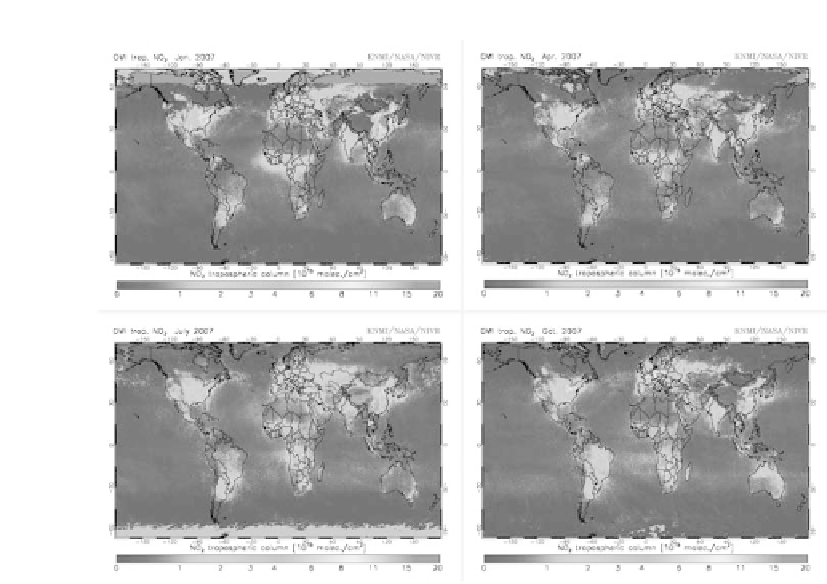
Figure 5.
The NO
2
readily travels hundreds of miles at higher concentrations, and can travel
thousands of miles at moderate or lower concentrations, as shown in this series of images from 2007.
Red indicates the highest density, and purple the lowest, for the full column from the surface to the
top of the troposphere. There can be a fairly strong correlation between atmospheric and ground-
level concentrations, depending on local conditions.
Source:
ESA
Schoeberl says the solutions to this problem likely lie in better algorithms to ana-
lyze the satellite data, as well as in new instruments aboard satellites. But he expects it
may be a decade or so before there is a new ozone instrument in orbit.
For now, satellite images tracking ozone at an altitude of about 3-8 miles suggest
that ozone is coming largely from developed countries in the northern hemisphere and
from biomass burning (sometimes linked with human activities such as agriculture)
in the southern hemisphere. The highest concentrations tend to occur in the summer
months, although some areas—such as eastern China, California, and southwestern
Africa—can have elevated concentrations in other months.
A GLIMPSE OF THE ELUSIVE VOCS AND SO
2
Vehicles, power plants, industrial processes, and consumer products are major human
sources of VOCs, and vegetation is an important natural source. Most VOCs consid-
ered important from a health perspective—such as benzene, trichloroethylene, and
chloroform—tend to have spectral properties that are hard to distinguish by satellite.