Geoscience Reference
In-Depth Information
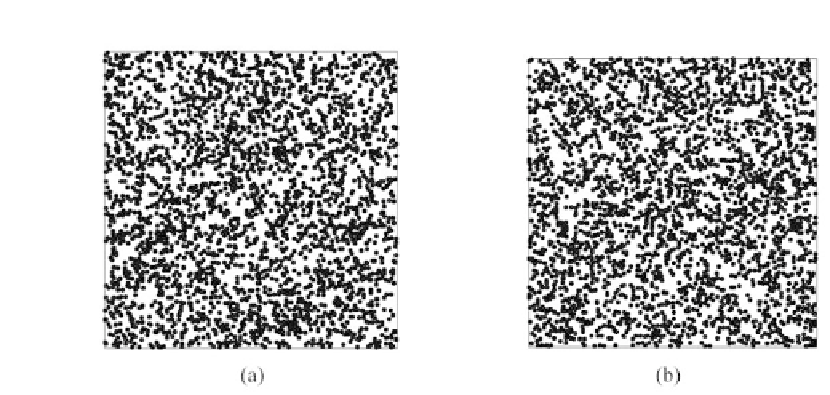
Figure 7.
Locations of the 3,000 samples in areas (a) A and (b) B.
Estimations and Conditional Simulations with Selected Samples
The LHS approach can also be used in SGS (Pebesma and Heuvelink, 1999; Xu et al.,
2005) and kriging estimation. However, because the LHS is conducted by shifting
simple random sampling, meaningful deviations exist when sample size is small
(Pebesma and Heuvelink, 1999; Xu et al., 2005). In this study, ordinary kriging esti-
mates and SGS simulations were performed based on the above variogram models of
3,000 samples for 7 NDVI images in areas A and B. Figures 8-11 show the maps of
kriging and averages of 1,000 realizations of SGS of NDVI images in 62,500 grids in
areas A and B. A comparison of actual NDVI images and NDVI images estimated by
kriging indicates that kriging estimation with sufficient samples provides the best lo-
cal estimates to capture actual NDVI images, but generally smoothed extreme values
of the actual NDVI images in areas A and B (Figures 8-11). Figures 12 and 13 show
NDVI maps produced by SGS simulations with 100, 500, and 1000 cLHS samples in
1999/10/31 for areas A and B. The kriging estimation results illustrate that interpola-
tion techniques such as kriging typically ignore phase information, which can result in
an over-smoothed view of the distribution of spatial variables and remove important
information about spatial discontinuities in a pattern (Deutsch and Journel, 1992; Lin
et al., 2001, 2008a, 2008c; Lobo et al., 1998), particular with an insufficient number
of samples (Figures 813). However, kriging interpolation algorithms produce maps
of the best local estimate and generally smooth local details of spatial variation of an
attribute (Goovaters, 1997).
The SGS results verify that the limits of spatial analysis and interpolations of land-
scape variables are based on semivariograms (or autocorrelation functions) solely,
stressing the need to account for spatial discontinuities (Lobo et al., 1998), particu-
larly in highly heterogeneous landscapes induced by large physical disturbances such
as the Chi-Chi earthquake. Therefore, procedures for interpolation of ecological vari-
ables must include information on spatial discontinuities, either directly from remotely
sensed images (assuming the phase pattern in the image and ecological variables are