Geoscience Reference
In-Depth Information
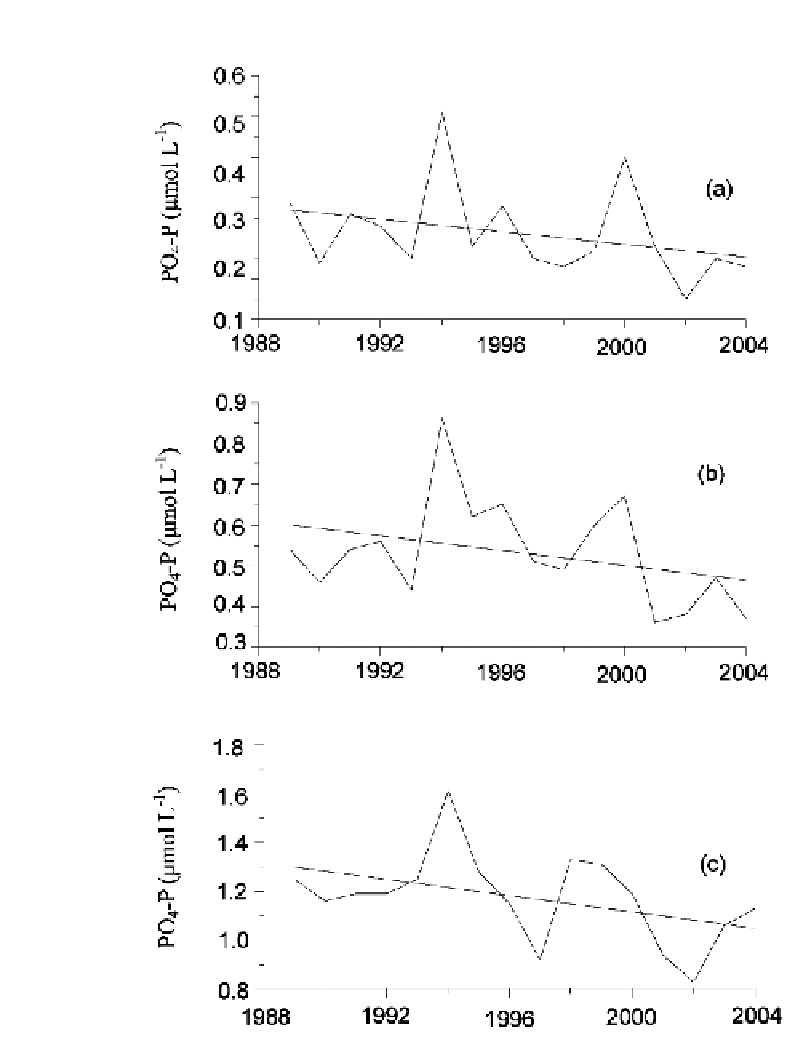
Figure 8.
Variation trends in seawater salinity in the nSCS during 1976-2004. (a), (b), and (c) show
the annual means of sea surface salinity (SSS), water column average salinity in the upper 200 m
(Sav) and salinity at 200 m (S200), respectively. The lines are linear regressions.