Geoscience Reference
In-Depth Information
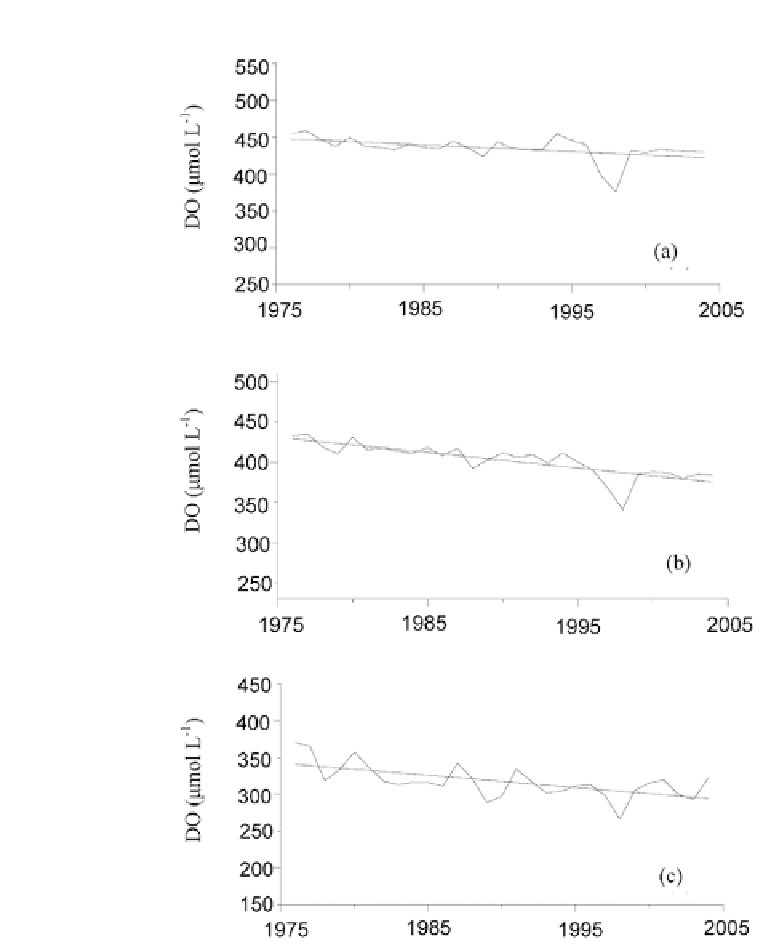
Figure 7.
Variation trends in N:P ratios in the nSCS during 1989-2004. (a), (b), and (c) show the
annual means of sea surface DIN:P (SSDIN:SSP), water column average DIN:P in the upper 200
m (DINav:Pav) and DIN:P at the 200 m layer (DIN200:P200), respectively. The lines are linear
regressions.
The decrease in P concentration is probably due to uptake by phytoplankton and
less P supply from deep water, due to the presence of the permanent thermocline (Shi
et al., 2001; Yuan and Deng, 1997a, b). Furthermore, since 1998, the reduction in N
limitation has increased the phytoplankton biomass and production (Table 3) and