Geoscience Reference
In-Depth Information
DN
max
DN
min
numberofbins
−
x
=
(3)
DN
in
−
DN
min
DN
out
=
(4)
x
where:
DN
max
= maximum value of digital numbers
DN
min
= minimum value of digital numbers
DN
in
= input digital number
DN
out
= output digital number after level slicing
The
DN
out
values obtained after the level slicing were categorized as either dam-
aged or non-damaged based on their values. Lower
DN
out
values represent the non-
damaged areas whereas higher values represent damaged areas.
Accuracy Assessment
The inner city of Adapazari was divided into 99 blocks of 300 m × 300 m size and
these blocks were used for the detailed accuracy assessment procedure. The results
obtained after the level slicing of the difference image (calculated from inverse
Fourier transformed images) illustrates the damaged and non-damaged areas. These
areas were compared with the 1/5,000 scale damage map for each block on a parcel ba-
sis to investigate the applicability of this method to automatically identify earthquake-
induced damage. The number of parcels in each block was evaluated individually and
error matrix for each block was created as shown in Figure 2.
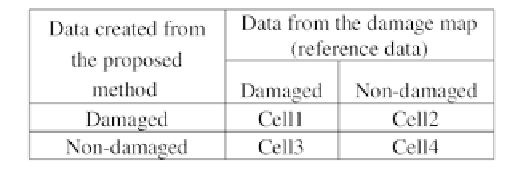
Figure 2.
Accuracy assessment of each block.
Each block has four values corresponding to parcels identifi ed as damaged both
in the damage map and with the proposed method (cell 1), parcels identifi ed as non-
damaged both in the damage map and with the proposed method (cell 4), parcels iden-
tifi ed as damaged in the damage map but non-damaged with the proposed method (cell
3) and parcels identifi ed as non-damaged in the damage map but damaged with the
proposed method (cell 2). Overall accuracy of each block was calculated by summing
diagonal elements and dividing them to total number of parcels within that block. The
equation of the overall accuracy for a block based on the values described in Figure 2
is as follows: