Geoscience Reference
In-Depth Information
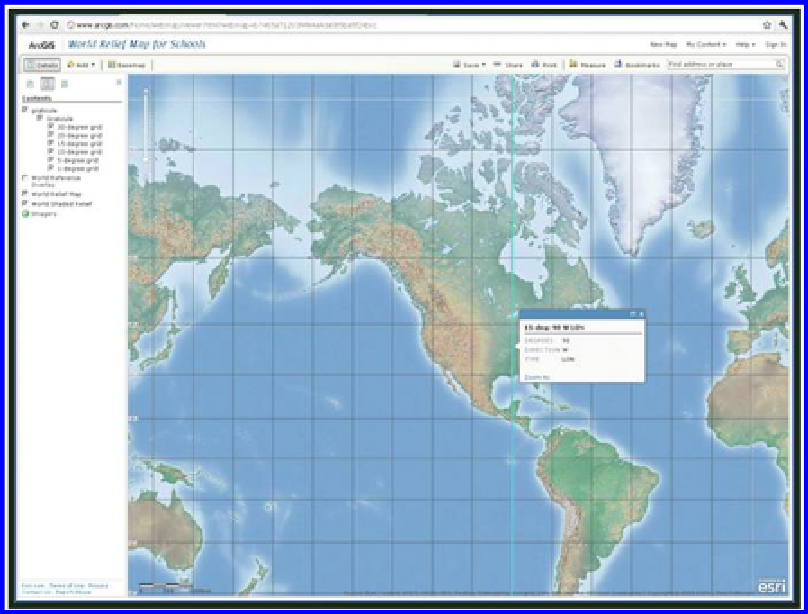
Figure 2.4 Map in ArcGIS Online showing uneven spacing between lines of latitude,
but even spacing between lines of longitude, on this modified Mercator projection.
Source of base maps: Esri software.
chosen (miles or kilometers). How closely does this measured distance match
the distance indicated in the discussion earlier in this chapter? For example,
at Quito, the distance appears to be around 110 km, and the accepted value
we discussed earlier was 111.319 km. What are a few reasons why they do not
match? It depends on where you click with your mouse, which is in itself an
imperfect science, and the map projection used on this map. Next, move to
60 degrees north latitude. What is your expected value, based on the discus-
sion earlier in this chapter, of the length between each degree of longitude?
Measure the one degree distance and compare your results to your expected
value. One measured value by Kerski was 56 km. The expected value was 56
according to the earlier discussion, it should be exactly half of the equatorial
circumference, at 60 degrees north latitude. Does it make sense that if the dis-
tance between longitude lines decreases as you move, then the land masses
in this projection have to be “stretched” to it between those lines? It should
make sense based on our discussions in this topic—the closer to the poles
you move, the more the areas become distorted on many maps.
Move back to the Equator and repeat the above process for latitude. First, mea-
sure the distance between each successive whole degree of latitude near the
Equator, such as between one degree north and two degrees north. How does
Search WWH ::

Custom Search