Geoscience Reference
In-Depth Information
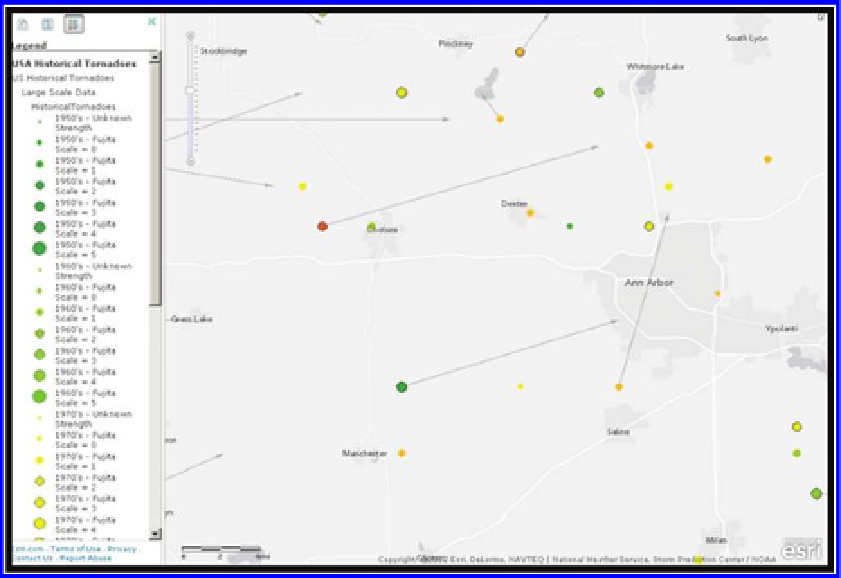
Figure 8.5 Mean tornado tracks, Ann Arbor, MI. Source of base map: Esri software.
Yet even though we are now examining tornadoes as tracks and not simply as
point data, do you think the tracks are entirely accurate? Do you think they
are actually as linear as they appear on the map, or can they be sinuous in
shape? You should be thinking about the influence of local terrain and the
rapidly changing nature of storms that could result in a sinuous path, or even
a tornado that touched down and lifted up numerous times during its path.
Also, do you believe that the track of destruction is as narrow as it appears as
represented by a single line? Do some research on tornado width. What is the
typical range of width of tornadoes? You will discover that tornadoes range
from a few meters to hundreds or even thousands of meters (yes, several
kilometers) wide. How could this width be portrayed on a map? This width
could be shown as a gray or hatch pattern in a polygon, instead of a line. But
the limitations there are that data on the width of tornadoes as they move is
extremely difficult to measure, given their short life spans and the difficulty
of obtaining such measurements.
Furthermore, consider that besides the destruction caused
within
the tor-
nado, much destruction occurs
near
a tornado. In other words, tornadoes
wreak havoc far beyond their own track lengths and widths as portrayed on
maps like this. How could this proximity be represented on the map? Again,
the zone of destruction could be shown as a polygon with shading that
becomes lighter farther away from the tornado and darker near the tornado.
Recall your earlier work with buffers. Applying a standard buffer around a
Search WWH ::

Custom Search