Geoscience Reference
In-Depth Information
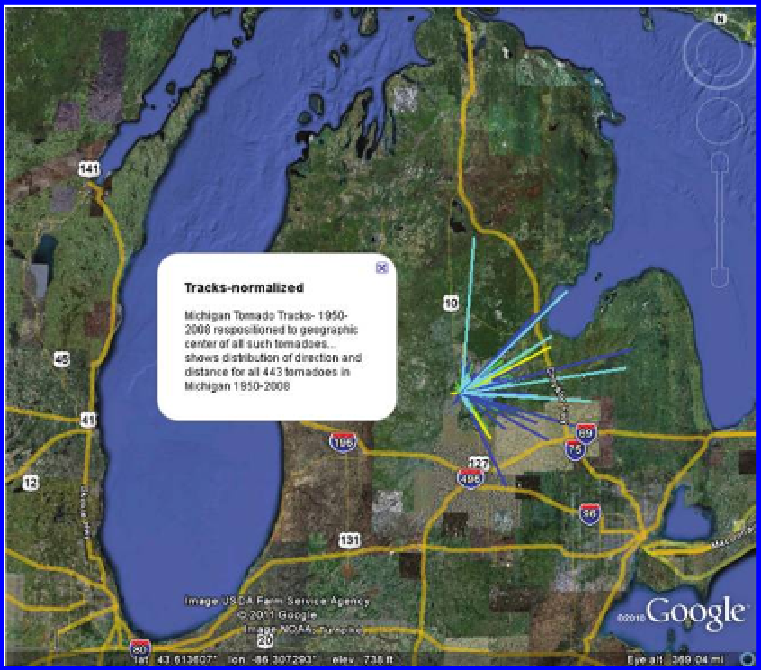
Figure 8.2 Tornado tracks in Michigan. Source: Roger Rayle gave permission to use
his image of re-rendered data originally from, a Google Earth basemap at
http://
www.srh.noaa.gov/gis/kml/TIMS/USTornadoes1950-2008-TIMS.kml.
component and a vector component (see activities in the Practice section of
this chapter).
In the next section, you will have the opportunity to examine tornado data
yourself, using the data produced from a web-based GIS, while considering
concepts of data quality, direction, length, temporal patterns, spatial patterns,
density, and other factors.
8.4 Examining the distribution of tornado data
In this section, you will consider key mathematical and spatial concepts while
using an online GIS to examine tornadoes. Consider the distribution of tor-
nadoes in the USA as gathered by the National Oceanic and Atmospheric
Administration (
Figure 8.3
).
This map layer shows the tornado touchdown points in the United States,
Puerto Rico, and the US Virgin Islands, from 1950 to 2004. Statistical data
were obtained from the National Weather Service, Storm Prediction Center
Search WWH ::

Custom Search