Geoscience Reference
In-Depth Information
resident in that area has. It is a nominal scaled number and not a ratio scaled
number. Thus, tapestry “20” is not “more” or “less” than tapestry 19.
7.4.2 Using ArcGIS desktop for demographic analysis
To analyze census data, you need two components: (1) The demographic data,
and (2) the associated statistical areas as spatial data layers in GIS format.
Think of the demographic data as what you “pour into” your statistical areas.
One component of ArcGIS Online is US Demographics. Here we use the
demographic layer from ArcGIS Online inside ArcMap. One way to access and
map Census data is with ArcGIS Online,
http://www.esri.com/arcgisonline
.
Look for where the concept of nested hierarchy enters the picture.
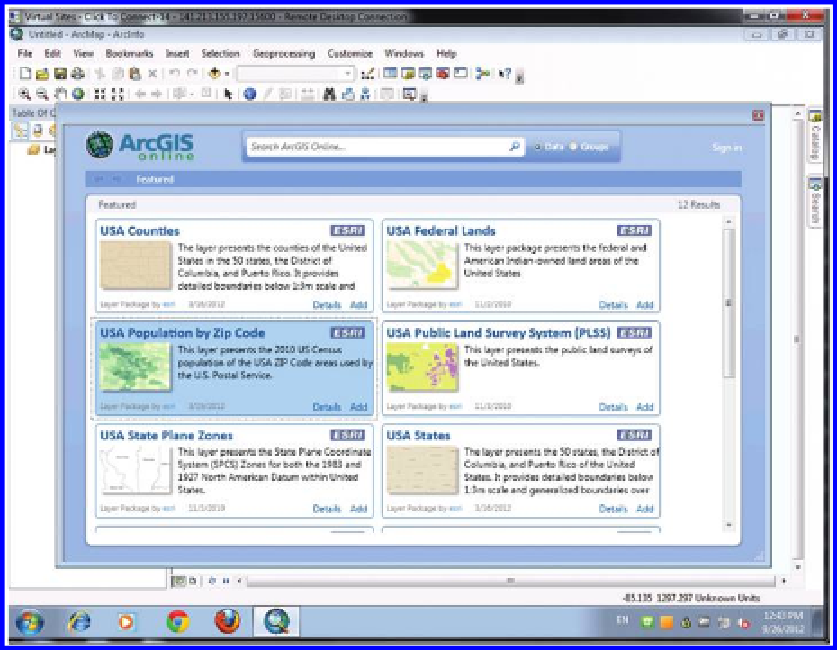
Here, we will use ArcGIS Online to explore racial and ethnic diversity in the
USA. Start ArcMap with a new map document. Select “Add Data from ArcGIS
Online” and select the USA Population by Zip Code box and click “add” to
add the data as a premade map document (.mxd) to your ArcMap session
(Figure 7.12).
Access the Bookmarks menu and select “California.” Once in California,
zoom to any part of the state. You will see three layers: Population Growth
Figure 7.12 Obtain Census data online, Esri software.
Search WWH ::

Custom Search