Geoscience Reference
In-Depth Information
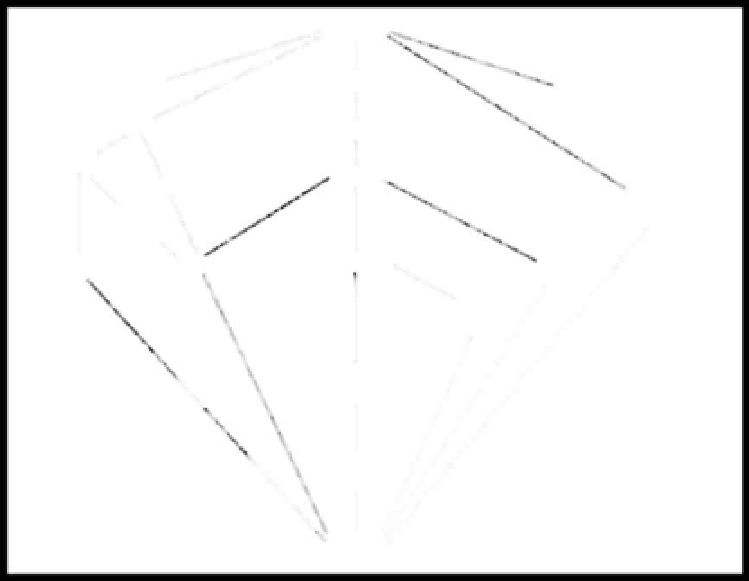
Nation
Regions
ZIP codes
Metropolitan areas (MAs)
Urban areas
Divisions
Inside UAs
States
Outside UAs
Urban
fringe
Central place(s)
American Indian and
Alaska native areas
Counties
Places
Voting districts
County
subdivisions
Census tracts/Block
numbering areas
Block
groups
Blocks
Figure 7.10 Geographic hierarchy for the 1990 Decennial Census, represented as
GARM/Ch2GARM.pdf
nesting patterns (or similar relationships) and there are diagrams showing
connection patterns, as mapplets or graphs, within the hierarchy.
In the following section, you will have the opportunity to use selected con-
cepts about hierarchy from this chapter in a hands-on manner. First, you will
use ArcGIS Online to examine population data at multiple scales to examine
the effect of the geographic hierarchy and scale on several variables. Then,
you will use ArcGIS for Desktop to use population data in an even more rigor-
ous way through the analytical toolkit available in that software. But in both
analyses, you will examine spatial pattern, hierarchy, and statistical measures.
7.4 Practice using selected concepts from this chapter
7.4.1 An introduction to census tabulation areas: Using ArcGIS
online for demographic analysis
Go to
http://www.arcgis.com/home
and search for a map entitled “USA
Demographics for Schools.” Under the resulting thumbnail for the map by
cfitzpatrick, open the ArcGIS Online map viewer. This map can be accessed
directly by accessing
http://www.arcgis.com/home/webmap/viewer.html?we

Search WWH ::

Custom Search