Geoscience Reference
In-Depth Information
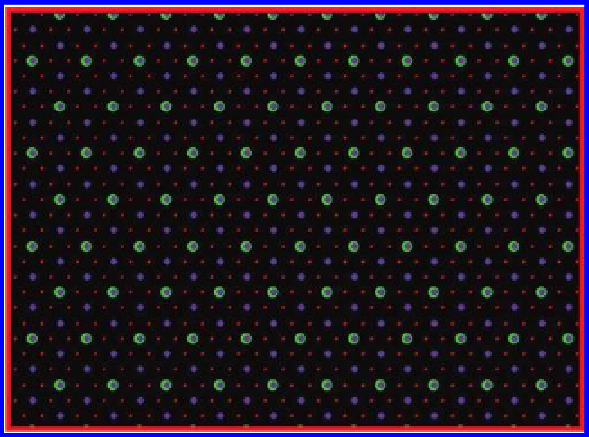
Figure 7.4 A triangular lattice of dots with locations for competing locations enter-
ing the picture at three levels—red, the smallest, blue next, and green the largest.
Source: Arlinghaus, S. L. and W. C. Arlinghaus. 2005. Spatial Synthesis: Volume I,
Centrality and Hierarchy. Book 1. Ann Arbor: Institute of Mathematical Geography.
Figure1_3new.gif
Suppose, in a triangular lattice of villages, that one village adds to its retailing
activities. After some time, growth occurs elsewhere. How might other vil-
lages compete to serve the tributary areas? How will the larger, new villages
share the tributary area? Figure 7.4 shows a hierarchy of competing centers.
The smallest villages are represented as small red dots; next nearest neighbors
competing for intervening red dots are represented in blue; and, next nearest
neighbors competing for intervening blue dots are represented in green. Of
course, one is usually only willing to travel so far to go to a place only slightly
larger, so the fact that the pattern could be extended to an infinite number of
levels, beyond green, may not mirror the second postulate. Over time, how-
ever, one might suppose further growth and an entire hierarchy, of more than
the three levels suggested here, of populated places.
7.3.3 Visualization of hexagonal hierarchies using plane
geometric figures
7.3.3.1 Marketing principle
Consider a central place point,
A
, in a triangular lattice. Unit hexagons (funda-
mental cells) surround each of the points in the lattice and represent the small
tributary area of each village. Growth at
A
has distinguished it from other
villages in the system. It will now serve a tributary area larger than will the
unit hexagon. There are six villages directly adjacent to
A
. The unit hexagons
represent a partition of area based on even sharing of the area between
A
and
Search WWH ::

Custom Search