Geoscience Reference
In-Depth Information
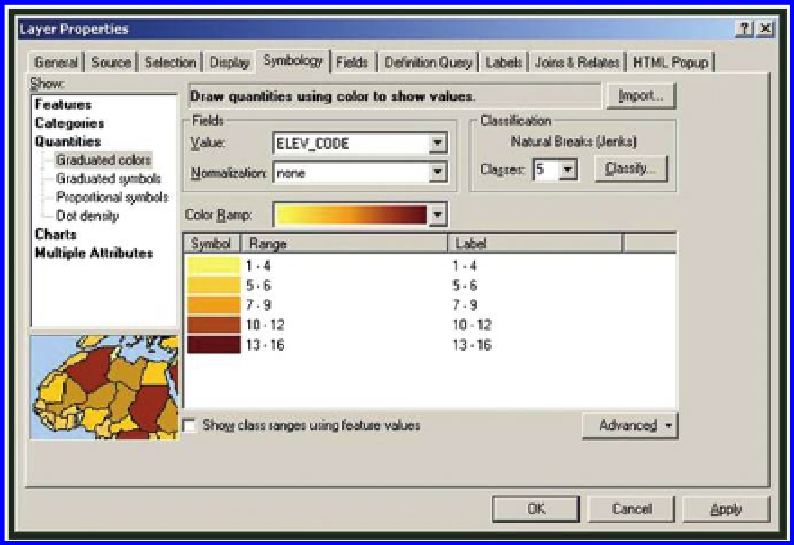
Figure 6.17 Elevation Code layer. Classifying data into ranges using Esri software.
Source of base map: Esri software. Look at elevation on other surfaces, such as a
lunar map with high resolution patches:
http://target.lroc.asu.edu/da/qmap.html.
layer
→
Properties
→
Symbols
→
Change to Graduated Symbols
→
change the
Value to Elev Code
→
OK.
Change the symbology to Unique Value and observe your map. Change the
symbology back to Single Symbol. What is the difference between maps
symbolized by: Single Symbol, Unique Symbols, and Graduated Symbols?
The map symbolized as single symbol as well as unique symbols make
it impossible to interpret the elevation values. A middle ground is repre-
sented by graduated symbols that show elevation as a series of about five
categories.
Turn off Elevation. Change the symbols of the Country map layer to Graduated
Colors on Field (value) POP2005 (Population in 2005). Countries will be clas-
sified under the Natural Breaks classification method. In the Symbology win-
dow, click on Classify and observe the histogram which will appear as in
Figure 6.18
.
Why are there so many records in the first class? So many
records exist because most countries in the world actually have a small popu-
lation. What is the mean population of world countries? The mean population
is 25.8 million. What is the Standard deviation of the population of world
countries? This value is 111.8 million. What is the total world population
according to this data set? This is 6.4 billion according to this data set, and
because the world population now is 7.2 billion, this data set is obviously
out of date.
Search WWH ::

Custom Search