Geoscience Reference
In-Depth Information
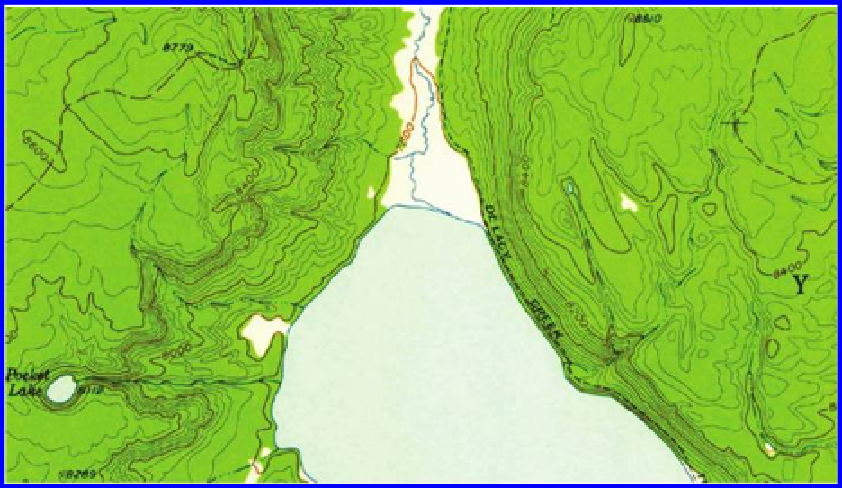
Figure 6.13 This image shows a sample of a professionally made map with contours.
Closely spaced contours reflect steep slopes. Source: USGS, The National Map, US
Topo,
http://nationalmap.gov/ustopo/index.html
care in interpretation of visual evidence reconstructed from numerical pattern
6.14
shows a structural model of Varroa mite (pest attacking honey bees) dif-
fusion through time (Sammataro and Arlinghaus, 2010). In the online version
(Java-enabled browser), pull the red year box for 1963 all the way across to
the right (use the scroll bar) and then drag and drop various pieces of the left
side of the mapplet to unravel it and see the pattern of possible time points of
intervention opportunity, data breakpoints, at various stages in the diffusion
process. Where clipping out a single box would disrupt the flow, that location
might suggest intervention opportunity. If a Mapplet box “sticks” on another,
pull it a bit in a different direction. Generally it is possible to move beyond the
obstacle. Mapplets seem to offer a wide array of possibilities for description,
interpretation, and analysis of complex spatial systems. Click on the link, in
the References below, to see more of the Mapplet than can be displayed in the
static image (Arlinghaus, 2000).
The idea of “partition” is one that is rich and varied. Readers interested in more
conceptual material on this topic and on related topics might consider reading
works on location theory (Haggett, 1977). Try von Thünen (1966 translation)
and agricultural location; try Weber (1928) and industrial location; or, try a
more current work such as the one by Puu (1997).
In the next section, you will have the opportunity to put selected concepts
from this chapter into practice, and classification in particular, first with a
web-based Geographic Information System (GIS) and then with a more pow-
erful desktop-based GIS.
Search WWH ::

Custom Search