Geoscience Reference
In-Depth Information
5.4.3 Creating your own dot density maps: Exercise
Try to work the part of the Denver Internet Café Location exercise having to
do with dot density mapping on your own. Use the .mxd file created in work-
ing with material at the end of Chapter 3. Join the downloaded Census .dbf to
the Block Group shape file. The idea of a “join” in the world of GIS is parallel
to the idea of “union” in the world of set theory. When two tables are joined,
the new table contains all the entries of both; hence, the set of entries in the
new table is the union of the set of entries in each of the two original tables.
Then, double-click the block group layer to open it and navigate to Symbology.
Select the dot density option under “Quantities” and create a map for the 18
to 21 year-old category. Also create a choropleth map (choose “Graduated
color”).
Figure 5.9
shows such a dot density map with the dot scatter ran-
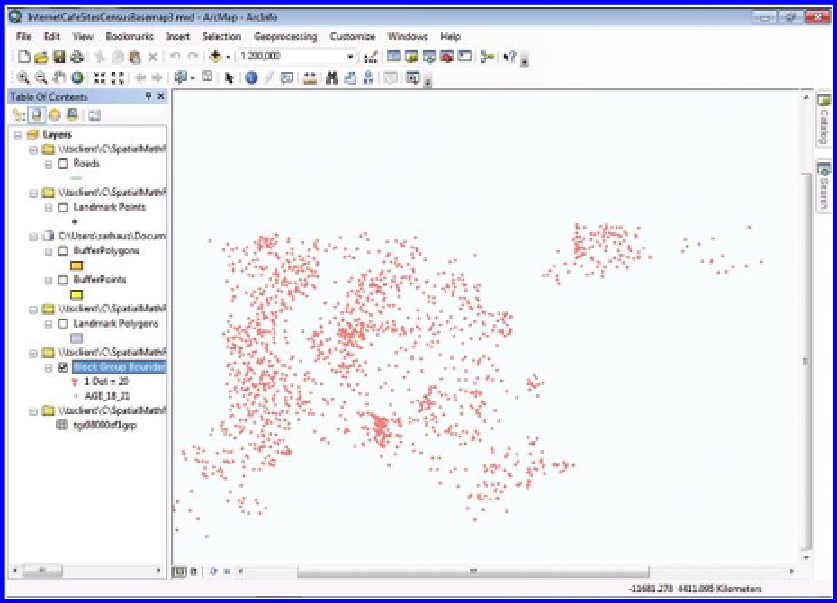
domized at the Block Group level. Figure 5.10 shows the same map with the
Block Group boundaries removed so that the clusters of dots are evident at
the city-wide level. If you tried to construct this map on your own, where did
you have difficulty? How does the dot density map of the 18 to 21 year-olds
compare to the choropleth map (
Figure 5.11
)
in terms of conveying meaning?
Figure 5.10 Dot density map of 18 to 21 year-olds with dot scatter randomized within
Block Groups. Block Group boundaries are removed to foster cluster visualization
at the city-wide scale. Source of base map: Esri software.
Search WWH ::

Custom Search