Geoscience Reference
In-Depth Information
Western US mean temperature
8
miroc3_2_medres.1
ipsl_cm4.1
ukmo_hadcm3.1
6
miub_echo_g.1
gfdl_cm2_0.1
mpi_echam5.1
gfdl_cm2_1.1
ncar_ccsm3_0.1
cnrm_cm3.1
4
inmcm3_0.1
bccr_bcm2_0.1
cccma_cgcm3_1.1
ncar_pcm1.1
mri_cgcm2_3_2a.1
2
giss_model_e_r.2
csiro_mk3_0.1
0
-2
1950
2000
2050
2100
Western US mean precipitation
60
30
0
-30
-60
1950
2000
2050
2100
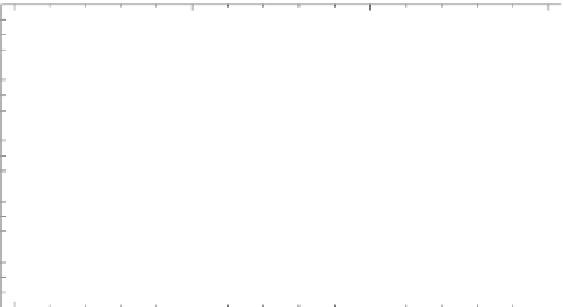
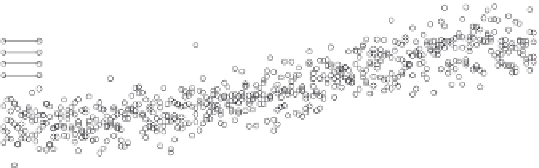
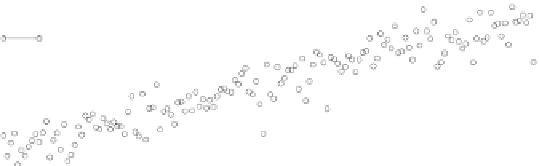
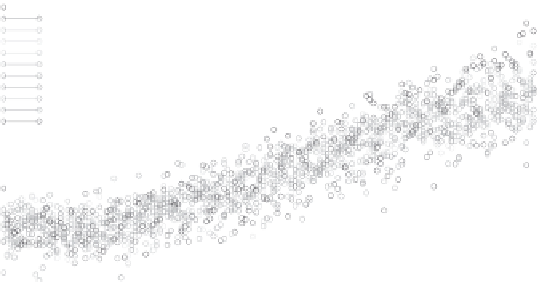
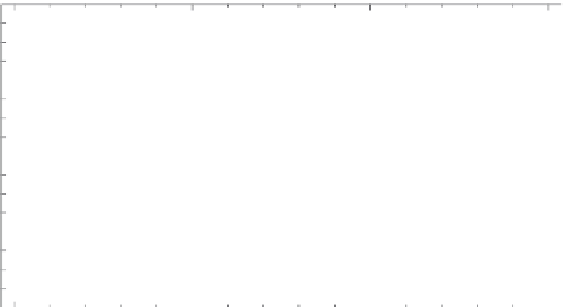
FIGURE 1.6
(See color insert.)
Western-US. annual. mean. temperature. and. precipitation.
for.16.climate.models.(colored.circles,.names.and.runs.shown).along.with.the.all-model.mean.
(heavy.black.curve)..Greenhouse.gas.and.aerosol.forcing.follows.the.observed.climate.record.
for.1950-2000.and.then.the.A1B.scenario.for.2000-2100.
obtain.the.model.output.for.a.wide.range.of.scenarios..We.obtained.the.irst.available.
run.from.each.of.the.16.models.on.the.GDO.averaged.over.the.domain.30°-49°N,.
107.5°W.to.124.5°W..We.formed.annual.means.and.compared.the.2000-2100.values.
with.the.1950-2000.reference.period.(Figure 1.6).
The.warming.rates.over.the.twenty-irst.century.range.from.2.2°C.for.CSIRO3.0.
to.5.3°C.for.MIROC3.2,.and.the.mean.warming.across.models.is.3.4°C..By.the.mid-
twenty-irst. century,. the. distributions. have. shifted. considerably. from. those. of. the.
late-twentieth.century:.the.coldest.years.in.the.coldest.model.are.already.as.warm.
as.the.warmest.years.in.any.model.for.the.recent.historical.climate..For.the.warmest.
models,.the.differences.emerge.a.decade.or.two.earlier..By.contrast,.the.precipitation.