Geoscience Reference
In-Depth Information
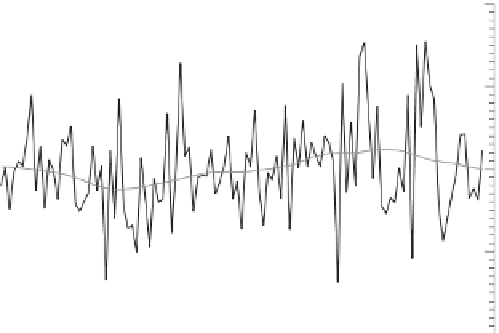
700
600
500
400
300
1900
1920
1940
1960
1980
2000
FIGURE 1.4
Water.year.(October-September).precipitation.1899-1900.through.2009-2010.
for.the.11.western.United.States..Data.from.4-km.resolution.PRISM.grid.using.the.WRCC.
Westmap. (www.cefa.dri.edu/Westmap/). application.. Smooth. grey. curve. calculated. using.
loess.as.in.Figure.1.3.
of.the.patterns.of.precipitation.variability.because.the.sign.of.the.it.can.change.over.
short.spatial.distances.and.with.slightly.different.periods.of.analysis..The.time.series.
of.total.precipitation.(which.includes.the.water.equivalent.in.snowfall).for.the.October.
through. September. water. year. illustrate. temporal. patterns. (Figure 1.4).. The. time.
series.of.average.total.precipitation.for.the.11.western.states.shows.some.interesting.
features,.especially.a.pronounced.increase.in.the.mid-1970s.in.both.the.variance.and.
the.year-to-year.persistence.of.precipitation.anomalies,.as.has.been.noted.by.Hamlet.
et.al..(2005).and.Pagano.and.Garen.(2005)..Many.of.the.extreme.years—both.dry.
and. wet—have. occurred. since. 1975.. The. increase. in. year-to-year. persistence. (i.e.,.
multiyear.episodes.or.regimes).is.visible.irst.as.several.unusually.wet.years.in.the.
early.1980s,.which.were.followed.by.several.unusually.dry.years.in.the.late.1980s,.
then.several.wet.years.in.the.late.1990s,.then.several.dry.years.in.the.early.2000s..
There.is.little.theoretical.basis.to.expect.such.a.shift.to.accompany.rising.greenhouse.
gases,.and.it.may.simply.be.a.statistical.artifact.of.a.red.noise.time.series.
h
ydrologiC
r
esponses
To
C
hanges
in
T
emperaTure
Fluctuations.in.streamlow.are.closely.linked.to.luctuations.in.precipitation,.but.a.
large.body.of.literature.emphasizes.that.western.hydrology.also.responds.to.tem-
perature.. An. analysis. of. ine-scale. gridded. meteorological. data,. speciically. the.
fraction. of. annual. precipitation. falling. at. temperatures. between. 0°C. and. -6°C,.
what. might. be. called. warm. snow,. illustrates. the. West's. hydrologic. sensitivity.
to. temperature. luctuations. (Bales. et. al.. 2006).. Temperature. increases. of. 2-4°C.
(likely. to. occur. during. the. twenty-irst. century;. see. the. following). during. pre-
cipitation. events. could. lead. to. a. considerable. increase. in. precipitation. falling. as.
rain.rather.than.snow..The.more.immediate.runoff.has.numerous.hydrologic.and.