Geoscience Reference
In-Depth Information
3. Site characterisation
The investigated regions may be divided into cells by a grid system and site characteri-
sation may be performed for each cell based on the available borings and other relevant
information by defining a representative soil profile. Shear wave velocity profiles need
to be established down to the engineering bedrock with estimated shear wave velocity of
700-750m/s.
Thecasestudyselectedforevaluatingtheeffectsofsitecharacterisationaswellasscaling
procedures adopted for site response is near the city of Izmir (Durukal et al., 2005). The
site response analyses were conducted using Shake91 for the four soil profiles where in-
hole shear wave velocity measurements were performed previously. These four borings
are at the same site with spacing around 100m, thus it is possible to assume that all of
these four borings with measured shear wave velocity profiles could be in the same cell.
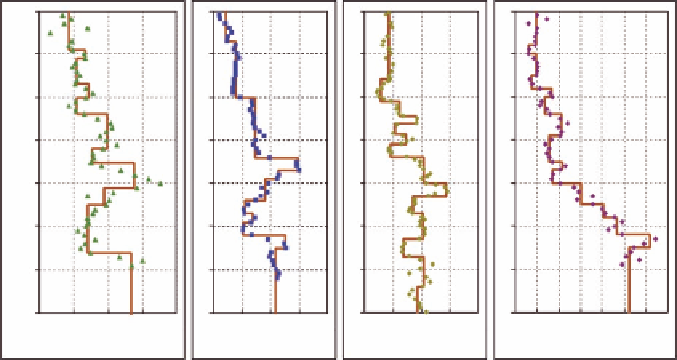
The measured shear wave velocity profiles given in Figure 4.5 indicate the variability
in the site conditions at one cell where for all practical purposes only one site specific
elasticaccelerationspectraisneededformicrozonationandtoevaluatethebuildingstock
vulnerability.
The effects of scaling for each soil profile were evaluated together to observe the
effects of site variability in relation with the scaling of input motion. The scaled accele-
ration records were applied as rock outcrop motion where the engineering bedrock
(
V
s
=
750m
/
s
)
was taken at 45mdepth for four soil profiles.
The regional earthquake hazard analysis yielded an earthquake magnitude of 6.5-7.0
with an epicentre distance of 10-20km. The hazard compatible input earthquake data
were composed of 20 acceleration time histories recorded between 10 and 20km fault
distances. Site response analyses were conducted using scaling parameters determined
0
0
BH4
BH5
BH6
BH8
0
0
5
5
5
5
10
10
10
10
15
15
15
15
20
20
20
20
25
25
25
25
30
30
30
30
35
35
35
35
100
200
300
400
500
100
200
300
400
500
100
200
300
400
500
100
200
300
400 500
600 700 800
Shear Wave Velocity (m/s)
Shear Wave Velocity (m/s)
Shear Wave Velocity (m/s)
Shear Wave Velocity (m/s)
Fig. 4.5. Four soil profiles used insite response analyses forthe case study