Geoscience Reference
In-Depth Information
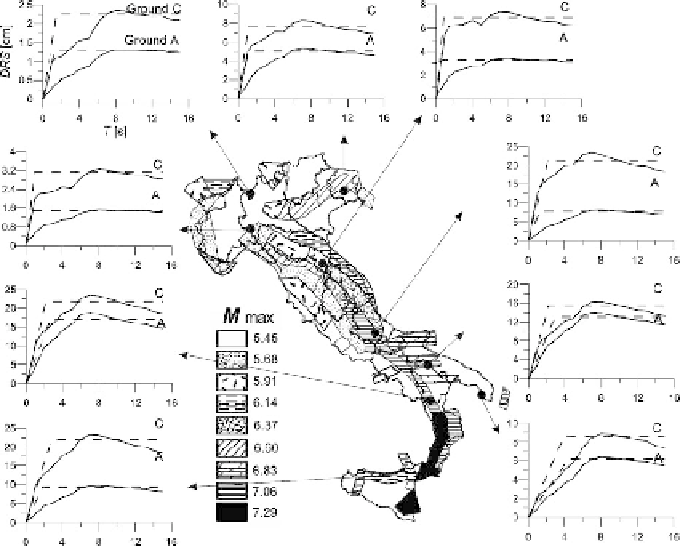
Fig. 2.16. Map of the maximum magnitudes inthe ZS9 model of SSZs. UHspectra for
ground types A and Carealsoshown at selected locations and compared withthe
bi-linear approximation proposed in thisstudy (Section2.5). The
DRS
ordinates
areincm, the periods on theabscissa ins
5.5. SPECTRAL DISPLACEMENT MAPS
Hazard maps in terms of spectral displacement have been produced with the previous
criteria and computational tools. One example, shown in Figure 2.17, illustrates the
D
10
map for ground type A and for 475 years returnperiod.
The comparison between the SSZs maximum magnitude map (Figure 2.16) and the
D
10
map(Figure2.17)highlightsthestrongdependenceoflongperiodspectraldisplacement
onmagnitude.Figure2.17indicates,infact,that
D
10
islessthan3cmforthemostpartof
NorthernItaly,whileintheSouthernApenninesandSicilyitreaches18cm.Furthermore,
according to the experts' opinion (Calvi, 2006), the value of 3cm represents a threshold
for structural analysis of current structures, i.e. the minimum response displacement for
which any new structureought tobedesigned.