Geoscience Reference
In-Depth Information
1
η
0.10
η
0.20
0.8
η
0.30
0.6
0.4
0
5
10
15
20
25
T
[s]
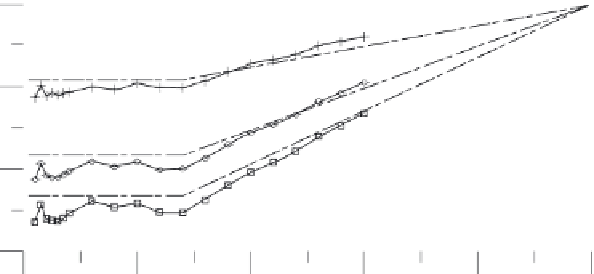
Fig. 2.14. Correction factors of spectral ordinates of overdamped spectra withrespect to
the 5% damped spectrum: solidlines withsymbols represent median ratiosderived from
the UH spectra computed byusing attenuation relations for different damping values,
whiledashed lines arethe ratiosyielded by (2.6)
5. Hazard representations in spectral displacements
5.1. CRITERIA FOR THE HAZARD ANALYSIS
In the engineering seismic hazard analyses, typically carried out by the classical method
of Cornell (1968), seismic sources may be represented either as SSZs that, according
to geological, seismological, and historical information, are regarded as homogenous in
termsofseismichazard,orasgeologicalstructureswiththeir3Dgeometrythatcangen-
erate strong events (characteristic earthquakes). While the full treatment of uncertainties
in PSHA would require a logic tree formulation, herein only some preliminary analyses
are presented without introducing a logic tree. For consistency with other projects men-
tioned in the Introduction, a model of homogenous SSZs, named ZS9, has been adopted
(essel.mi.ingv.it). This includes 36 SSZs for which the seismic parameters (Gutenberg-
Richter parameters, average depth, maximum earthquake magnitudes, focal mechanism)
were available. The attenuation relation (2.2) was used in the analysis, performed with
the CRISIS2003 code (Ver. 3.0.1) (Ordaz et al., 1991). The code allows for different
source-to-site distance definitions, including focal and fault distance. The fault equiva-
lent radius is estimated by different relationships (e.g. Brune, 1970). By comparing the
resultsobtained through the useof
R
(focal distance) and the fault distance derived from
(2.1), no significant differences have been found in the results for a return period of
475 years.