Geoscience Reference
In-Depth Information
0.04
0.04
Zone I
Zone II
T
01D
T
01D
0.03
0.03
N_YaX
N_45a45
N_YaX_rev
0.02
0.02
N_45p45_rev
0.01
N_YaX
0.01
N_45p45_rev
0
0
0.3
0.5
23 5
0.3
0.5
23 5
1
10
1
10
T [s]
T [s]
0.04
0.04
Zone III
Zone IV-V
T
01D
(zone IV)
T
01D
0.03
0.03
N_YaX_rev
N_45p45_rev
N_YaX_rev
(zone IV)
0.02
0.02
0.01
0.01
T
01D
(zone V)
SS_YaY
≡
SS_YaY_rev
N_YaX_rev
(zone V)
0
0
0.3
0.5
2
3
5
0.3
0.5
2
3
5
1
10
1
10
T [s]
T [s]
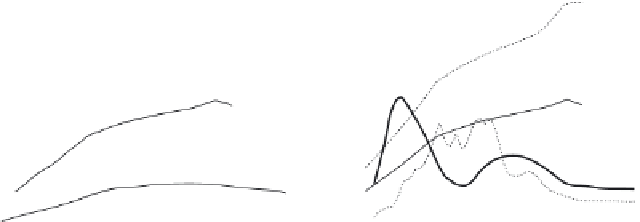
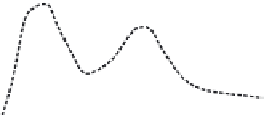
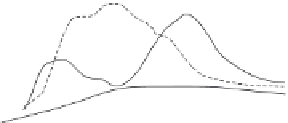
Fig. 2.13. 5% damped
DRS
fromsource simulations of valley-fault configurations. Only
the worst case average
DRS
at thesurface are shown for each valley zone, fordifferent
fault mechanisms and configurations as identified inFigure 2.12. Each graph also
displays the median
s.e.interval (shaded band) from (2.2), ground type C; the two
curves ingrey enclose themedian
±
s.e.band (unshaded) of the correction obtained
fromChoi et al. (2005) residuals (theirmodel B2 for Southern California). Indicated
witha vertical line isthe fundamental (average) 1D period for the zone considered
+
No results are shown for valley positions along the
X
axis nor for reverse fault mecha-
nisms. The mean
DRS
values in these cases are in fact comfortably enclosed within the
dispersion band of the attenuation relation. The worst cases involve in particular the nor-
malfaultmechanismwiththevalleylocatedalongtheYaxis,mainlyin“reverse”mode,
giving rise to relatively severe peaks at low periods, around 0.5s. The position of the
valleyalongthe45
◦
directionresultsinhighamplitudesonlyforthenormalfaultmecha-
nism, with dominant periods of about 1s. The strike-slip mechanism tends to emphasise
mostly1Dbasinresponse(see,e.g.zoneIIIinthefigure),whilenormalfaultmechanisms
generatehighpeaksprobablyrelatedto2Dbasinresponse,atlowerperiods.Theuseofa
“reverse” valley exposes the less steep side of the valley to direct incident wave arrivals,
featuring quite different (and unexpected) 2D effects probably related to the generation


