Geoscience Reference
In-Depth Information
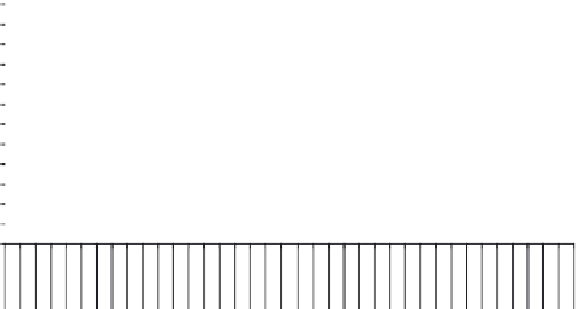
Structural Loss from the San Andreas Fault
Rupture by Hazard
1200
1100
1000
900
800
700
600
500
400
300
200
100
0
1234567891234567891234567812345612341
Mw and Scenario
E(x) Ground Shaking
σ Ground Shaking
σ Liquefaction
E(x) Landslide
Fig. 19.2. Structural lossfromtheSan Andreas fault rupture by hazard
and Kiremidjian, (2006). From that figure, the highest losses are from the magnitude 8.0
event on the San Andreas Fault, as expected. The contribution of losses due to liquefac-
tion appears to be twice as large as those due to direct ground shaking. It is not clear,
however, whether the large liquefaction losses are due to the crudeness of this compo-
nent of the model. Investigations are currently underway to develop more theoretically
sound models for liquefaction analysis that will enable more reliable estimation of these
losses (Brandenberg personal communication). It is expected that the liquefaction losses
willstillbethelargestcontributorstodirectstructuralloss,however,thepredictedvalues
may not be as large as reported herein. The loss from landslides is small in comparison
to ground shaking and liquefaction.
The total replacement cost for the 1125 bridges considered in this study is estimated to
$2,891 Million. The total expected value of structural loss reaches a maximum of $1.18
Billion for the San Andreas Fault scenarios and $1.01 Billion for the Hayward Fault
scenarios.
3.4. OPERATIONAL LOSS
Travel times to and from each TAZ in the San Francisco Bay Area were first evalu-
ated before an event to develop the baseline results. For that purpose the transporta-
tion network analysis program Transcad GIS from Caliper Corporation (2004) was
utilized. For each scenario event, the expected damage state for each bridge was deter-
minedandtherestorationtimefromHAZUSwereusedtodeterminethedurationoflim-
ited functionality. The network analysis was performed for 1, 3, 7, 14, 30, 180 and 265