Geoscience Reference
In-Depth Information
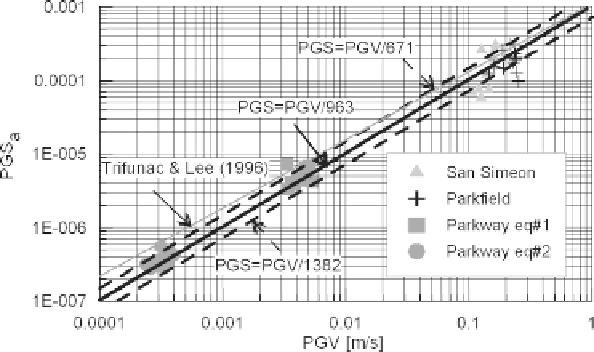
Fig. 18.2. Correlation of observed
PGSa
-
PGV
pairs forthe four earthquakes listedin
Table 18.1. To make theselected parameters independent of thereference system,
PGV
isthepeak absolute value of velocity, while
PGSa
isthepeak principal strain.
Superimposed isthe curve obtained by eq. (1a) of Trifunac and Lee (1996), considering
V
s
=
400m
/
s and epicentral distance
D
=
20km.
where
α
=
0
.
955 and
β
=
3
.
07, and PGV is in m/s. If the parameter
α
is forced to be
unity, thebest fit lineturns out tobe
PGSa
=
PGV
/ψ
(18.3)
ψ
=
/
where
s is the median value, while 671m/s and 1382m/s correspond to the
16
◦
and 84
◦
percentile, respectively.
963m
As shown in Figure 18.2, a good agreement is found with the relationship proposed
by Trifunac and Lee (1996), based on a large set of artificially generated synthetic
time histories for different soil conditions, who also found a weak dependence of the
PGS-PGV
relationship on earthquake magnitude, epicentral distance and local site
conditions.
These results suggest that the interpretation of
in eq. (18.3) as the horizontal wave
propagation velocity of the prevailing wave type (either apparent velocity of body waves
or phase velocity of surface waves) may be misleading. For example, the value of
ψ
ψ
deduced for the Parkfield event is about 2.5 times smaller than the apparent wave
propagation velocity estimated at the UPSAR site by spatial cross-correlation analyses
(Fletcher et al., 2006). Similarly, Bodin et al. (1997) deduced a
value from a micro-
array in Mexico City three times smaller than the prevailing phase velocity of surface
waves.
ψ