Geoscience Reference
In-Depth Information
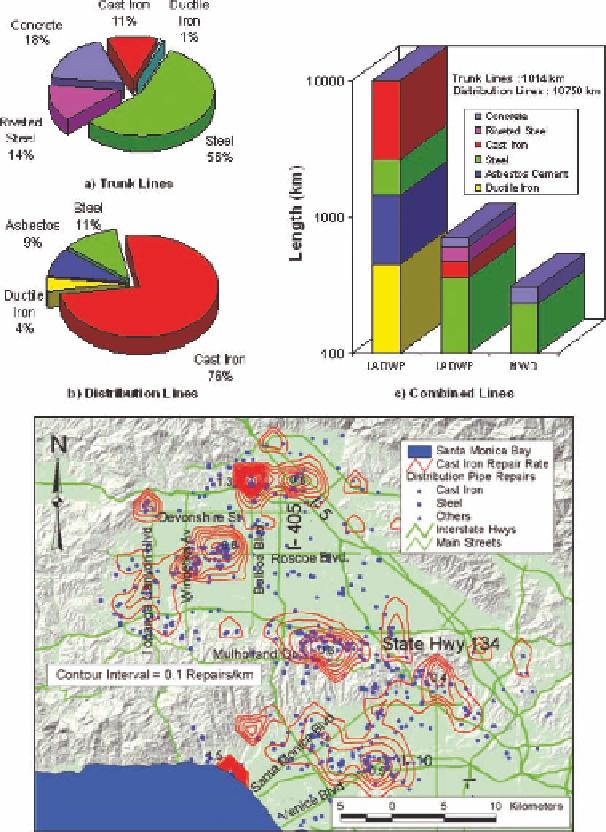
Fig. 17.5. Cast ironpipe repair rate contours for Northridge earthquake
(O'Rourke and Toprak, 1997)
then were drawn from the spatial distribution of repair rates, each of which was centered
on its tributary area. A variety of grids were evaluated, and the 2km
2kmgridwas
foundtoprovideagoodrepresentationofdamagepatternsforthemapscaleofthefigure
(Toprak et al.,1999).
×
The zones of highest seismic intensity are shown by areas of concentrated contours. In
eachinstance,areasofconcentratedcontourscorrespondtozoneswherethegeotechnical