Geoscience Reference
In-Depth Information
F
L
Depth
(m)
SPT N-value
Soil type
10
20
30
0.5
1.0
1.5
Fill
Silty sand
2.0
4.0
6.0
8.0
10.0
12.0
14.0
16.0
18.0
20.0
Fine sand
Silty sand
Fine sand
Sandy silt
Silt
Fig. 15.47. Soil profile at siteof in-sitescreen-pipe tests (Harada et al., 2006)
Vibratory pile driver
Screen pipe
Acc.
Acc.
Unliquefiable Layer
Acc.
P.W.P
Liquefiable Layer
P.W.P
Horizontal
distance to meter
Unliquefiable Layer
Interval
Fig. 15.48. Configuration of screen pipes and shaker (Harada et al., 2006)
effects. However, other cases developed much greater response. It is therefore important
that mitigation of liquefaction may cause another problem of inertia force which has to
be treated by structural reinforcement.
Thefollowingpartdescribesin-situtestsonscreenpipes.Thesoilconditionofthetesting
site is illustrated in Figure15.47. Four screen pipes were installed in a square configura-
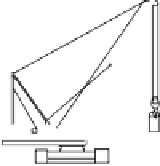
tion as illustrated in Figure15.48. Figure15.49 demonstrates a portable equipment for
installation of pipes. The spacing between pipes was 1.5m (case 2), 1.0m (case 3), or
0.5m (case 4). Case 1 had no screen pipe. The diameter and the opening of the pipe
were 48.6 and 0.3mm, respectively. Ground shaking was produced by a pile vibration at
18.3Hz.