Geoscience Reference
In-Depth Information
1
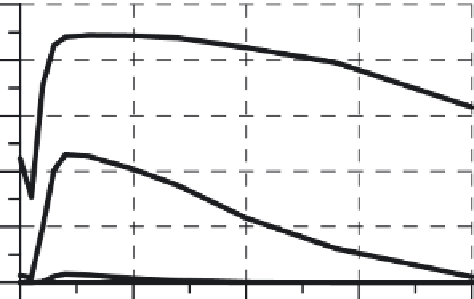
ky = 0.05
0.8
0.6
0.4
ky = 0.1
0.2
ky = 0.2
ky = 0.3
0
0
0.5
1
1.5
2
T
s
(s)
Fig. 14.14. Probability of exceeding 30cm of seismic displacement
fora
M
w
=
7 strike-slipearthquake at adistance of 10km using Eq. (14.6)
for selected
k
y
and
T
s
values
groundmotionintensityatthedegradedperiodoftheslidingmass(Figure14.13c),yield
coefficient is again shown to be a critical factor, with large displacements occurring only
for lower
k
y
values. Of course, the level of ground motion at a selected
k
y
value is also
a dominant factor. The uncertainty involved in the estimation of seismic displacement
for
S
a
(
.
)
=
.
8
g
is shown to be approximately half to double the median estimate.
Lastly, Eq. (14.6) was used with the results for the case presented in Figures 14.13a,b to
calculatetheprobabilityofexceedingaselectedthresholdseismicdisplacementof30cm
as shown inFigure 14.14.
0
45
s
0
5.6. MODEL VALIDATION AND COMPARISON
TheBrayandTravasarou(2007)modelwasshowntopredictreliablytheseismicperfor-
mance observed at 16 earth dams and solid-waste landfills that underwent strong earth-
quake shaking. Some of the case histories used in the model validation are presented
in Table 14.1. In all cases, the maximum observed displacement
is that por-
tion of the permanent displacement attributed to stick-slip type movement and distrib-
uted deviatoric shear within the deformable mass, and crest movement due to volumet-
ric compression was subtracted from the total observed permanent displacement when
appropriate to be consistent with the mechanism implied by the Newmark method. The
observed seismic performance and best estimates of yield coefficient and initial funda-
mental period are based on the information provided in Bray and Rathje (1998), Harder
etal.(1998),andElgamaletal.(1990).Completedetailsregarding theseparametersand
pertinent seismological characteristics of the corresponding earthquakes can be found in
Travasarou (2003).
(
D
max
)