Geoscience Reference
In-Depth Information
2.0
Rock site median, and 16th
and
84th
probability of exceedance lines
1.8
1.6
MHA,
rock (g) NRF
1.4
0.1
1.35
1.2
0.2
1.20
0.3
1.09
1.0
0.4
1.00
0.5
0.92
0.8
0.6
0.87
0.6
0.7
0.82
0.4
0.8
0.78
0.2
0.0
0.0
1.0
2.0
3.0
4.0
5.0
6.0
7.0
8.0
Ts-waste/Tm-eq
Fig. 14.9. Normalized maximum horizontal equivalent acceleration vs. normalized
fundamental Period ofslidingmass (Bray and Rathje, 1998)
1000
Mw 6.25 - Std. Error 0.35
Mw 7.0 - Std. Error 0.33
Mw 8.0 - Std. Error 0.36
100
10
1
0.1
Full Data Set Regression
16% and 84% prob. of exceedance
5% and 95% prob. of exceedance
0.01
log(U/kmax*D5-95) = 1.87-3.477*ky/kmax, Std. Error 0.35
0.001
0.0
0.2
0.4
0.6
0.8
1.0
ky/kmax
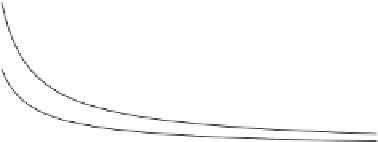
Fig. 14.10. Normalized base liner slidingdisplacements (fromBrayand Rathje, 1998)
where
g
. With an estimate of
k
y
,
the normalized seismic displacement can be estimated as a function of
k
y
/
σ =
0
.
298. The seismic coefficient
k
max
=
MHEA
/
k
max
using
Figure 14.10, or this equation
log
10
(
U
/(
k
max
D
5
-
95
))
=
1
.
87
−
3
.
477
(
k
y
/
k
max
)
±
ε
(14.2)