Geoscience Reference
In-Depth Information
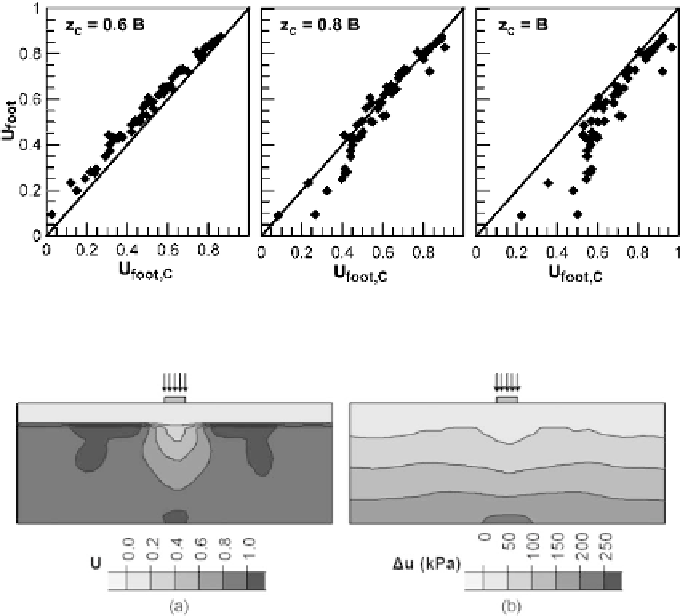
Fig. 11.14. Comparison between theaverage excess pore pressure ratiobelow the
foundation and that of different “characteristic” points on the foundation axis
Fig. 11.15. Typical distributionwithinthe liquefiable soil ofend of shaking (a) Excess
pore pressureratios
U
/σ
v
o
, and (b)excess pore pressures
= ∆
u
∆
u
loads. In an approximate way, this can be achieved if one focuses upon the distribution
within the foundation soil of the excess pore pressures themselves
instead of the
corresponding excess pore pressure ratios
U
. The reason is explained with the aid of
Figures11.15aand11.15b,whichshowthevariationof
U
and
(
∆
u
)
u
respectivelyattheend
ofshaking,obtainedfromatypicalnumericalanalysis.Itbecomesevidentthat,although
the spatial variation of
U
is considerably non-uniform, the respective variation of
∆
u
varies mostly with depth and is considerably more uniform in the horizontal direction.
Based on this observation, excess pore pressures in the free field (
∆
∆
u
ff
)
and under the
footing (
∆
u
f oot
)
maybeinterrelatedas
∆
u
foot
=
a
∆
u
ff
(11.9)
Furthermore, assuming that the free field soil is at a liquefied state,
u
ff
is approx-
imately equal to the geostatic vertical effective stress at the level of the characteristic
point
∆
(σ
v
o
,
and consequently the excess pore pressure ratio of the characteristic point
may be finally computed as
C
)