Geoscience Reference
In-Depth Information
1
1
(a) RS1
0.8
0.8
Norm. stress Dr=70%
0.6
Dev. stress Dr=30%
Dev. stress Dr=50%
Dev. stress Dr=70%
0.6
0.4
0.4
0.2
0.2
0
0
0
5
10
15
20
25
30
35
Fines content Fc (%)
1
1
(b) RS3
0.8
0.8
Norm. stress Dr=30%
Norm. stress Dr=50%
Norm. stress Dr=70%
0.6
0.6
Dev. stress Dr=30%
Dev. stress Dr=50%
Dev. stress Dr=70%
0.4
0.4
0.2
0.2
0
0
0
5
10
15
20
25
30
35
Fines content Fc (%)
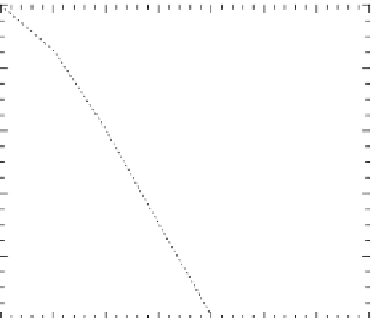
Fig. 8.25. Post-liquefaction deviatoric strength by monotonic undrained testsfor two
soils withdifferent fines content
havesomescatters,reflectingdifficultiesincontrollingprecedingcyclicstraininghistory
precisely as 10% DA strain, relative strength reduction normalized by the strength for
Fc
0 shown with thin curves in the figures may make the following observations pos-
sible. Both in RS1 and RS3, residual strength decreases more drastically in denser soils
than looser soils. Although, the relative strength decreases eventually to less than 10%
withincreasing
Fc
forallthesoils,itoccursbyasmallerincreaseof
Fc
inRS3thanRS1.
=
Thereasonmayagainbeexplainedbythedifferenceincriticalfinescontent
CFc
orvoid
ratiobetweenRS1andRS3mentionedbefore.Asoilstructurechangefromcoarse-grain
supportingtomatrixsupportingoccursnearthecriticalfinescontentwhichismuchlarger