Geoscience Reference
In-Depth Information
4. Effect of particle gradation on post-liquefaction behavior
It is well known that liquefaction-induced damage sometimes takes place not directly by
theseismicinertiaforcebutbystaticshearstresscausedbydeadweightsofstructuresdue
to the loss of effective stress after the onset of initial liquefaction. In order to investigate
the effect of particle gradation and fines content on the post-liquefaction behavior of
granular soils, undrained monotonic loading tests were carried out for the same soils
previously used immediately after prior undrained cyclic loading.
4.1. EFFECT OFPARTICLE GRADATION INPOST-LIQUEFACTION
SHEAR BEHAVIOR
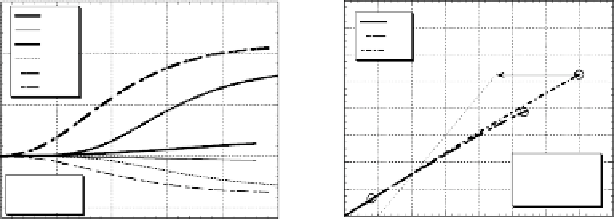
Figure 8.22(a) exemplifies deviatoric stress or pore-pressure versus axial strain relation-
ships obtained in undrained monotonic loading tests carried out without preceding water
drainage just after cyclic loading for the three soils, RS1, RS2 and RS3 with relative
densities of about 50%. In the cyclic loading tests, all specimens attained almost 100%
pore-pressure buildup and about 10% DA axial strain and hence can be defined as being
already liquefied in a normal engineering practice. In the initial response to monotoni-
callyincreasingstraininFigure8.22(a),deviatoricstressandpore-pressurechangegrad-
ually up to some asymptotic values. It is remarkable that despite the same
D
r
-value, the
induced stressisquite different for soilswith different particle gradations.
In Figure 8.22(b), typical effective stress paths are shown on the mean effective stress
(
p
)
plane. All paths start near the origin after the full pore-
pressure buildup and go up along straight failure lines to the right end marked with open
circles, although in the soil RS2 the path is a little curved near the right end. From the
slopesofthestraightsections,internalfrictionanglesforeffectivestress
versus deviatoric stress
(
q
)
φ
areevaluated
0
◦
forRS3.Thisindicatesthatpost-liquefactiondila-
tancy generating negative pore-pressure is more pronounced in well-graded soils despite
1
◦
forRS1,38
4
◦
forRS2,39
as36
.
.
.
1.5
1.6
(a)
(b)
RS1:q
RS1:
RS1
RS2
RS3
∆
u
RS2:q
RS2:∆u
RS3:q
RS3:∆u
1
1.2
Negative porepressure
0.5
0.8
0
0.4
Dr~50%
σ
c
'
=0.098 MPa
Dr~50%
σ
c
'
=0.098 MPa
−
0.5
0
0
5
10
15
20
25
0
0.2
0.4
0.6
0.8
Axial strain
ε (
Effective mean stress p' (MPa)
%)
Fig. 8.22. Stress-strain curves (a) and pore water pressure-straincurves (b) obtained
in post-liquefaction testsforthree soils (Kokusho et al.,2004)