Geoscience Reference
In-Depth Information
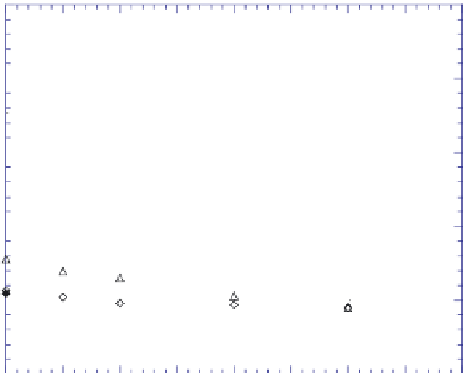
0.5
RS1 Dr=30%
RS1 Dr=50%
RS1 Dr=70%
RS3 Dr=30%
RS3 Dr=50%
RS3 Dr=70%
0.4
0.3
RS1 Dr=70%
RS3 Dr=70%
0.2
RS1 Dr=50%
RS3 Dr=50%
0.1
RS3 Dr=30%
RS1 Dr=30%
0
0
5
10
15
20
25
30
35
40
Fines content Fc (%)
Fig. 8.20. Liquefaction strength (stressratio) versus fines content
Fc
for RS1 and RS3
withdifferent relative density Dr
the density tends to first increase and then decrease with increasing fines content, taking
somepeakvaluesinbetween.Ifasoilissimplifiedasacombinationofgap-gradedcoarse
grains (sand or gravel grains) and fines, the fines fill the voids of the coarse grains up
to some limit (critical fines content;
CFc
) and then start to overflow the voids, leading
complete change of soil structure from coarse grain supporting to matrix supporting.
Correspondingly, the density increases in the interval
Fc
0to
CFc
because the void is
filledwithfineswithoutincreasingthetotalsoilvolumeandthenstarttodecreasebecause
the total volume increases withincreasing fines matrix of lighter density.
=
Figure 8.21 illustrates schematically how the voids of coarse grains are completely filled
with fines at the critical fines content, where
n
c
and
n
f
are porosities for coarse grains
andfines,respectively.Ifthisidealsituationispostulated,then
CFc
canbeformulatedas
=
n
c
−
n
c
n
f
/
1
n
c
n
f
CFc
−
(8.8)
Values of
n
c
and
n
f
are quantified from minimum and maximum densities, and hence
critical
CFc
can be calculated as listed in Table 8.2 for different relative densities
D
r
by
assuming that both coarse grains and fines have the same
D
r
as the total relative density.
Thus, under the simple assumption,
CFc
is calculated as 28%-29% for RS1 and 17%-
19% for RS3 for
D
r
30%-70%. This difference in
CFc
reflects largely different void
ratio between RS1 and RS3. These
CFc
values superposed in Figure 8.14 are somewhat
=