Geoscience Reference
In-Depth Information
100
80
60
40
TKS
T
G25
G50
G75
20
0
0.01
0.1
1
10
100
Sieve mesh size (mm)
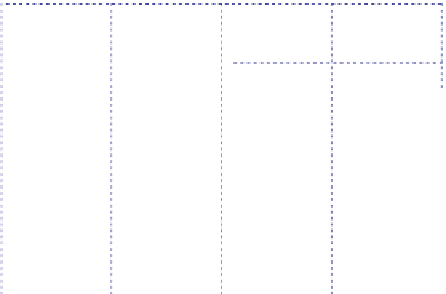
Fig. 8.6. Grain sizedistributions of five soilstested insoilcontainer
(Kokusho and Yoshida, 1997)
Table 8.1. Physical properties of tested soils
Soil
Mean grain
Uniformity
Soilgrain
Min. void
Max. void
density
ϕ
s
size
D
50
(
mm
)
coeff.
Cu
ratio
e
min
ratio
e
max
(
g
/
cm
3
)
TS sand
0.34
1.95
2.701
0.584
0.966
G25 gravel
1.13
5.67
2.674
0.334
0.567
G50 gravel
2.28
11.3
2.668
0.240
0.429
G75 gravel
7.30
31.1
2.653
0.161
0.308
TKS sand
0.15
1.88
2.660
0.595
1.023
2.1. S-WAVEVELOCITY
The S-wave velocity measured in the container tests for the five tested soils are first
normalized by thevertical and horizontal stresses,
σ
v
σ
h
,as
,
V
s
/
σ
v
/
p
0
σ
h
/
p
0
m
V
s
0
=
(8.1)
and the normalized S-wave velocity
V
s
0
is plotted versus void ratio in Figure 8.7, where
p
0
=
98kPa is unit pressure. The power
m
in the Eq. (8.1) was evaluated by regression
analysis on slopes of normalized
V
s
versus
σ
v
/
p
0
plots of individual test
results.Itisclearlyseenthat
V
s
0
isalmostlinearlyrelatedtovoidratiobuttherelationship
is different from one soil to another. Similar relationships derived by Hardin and Richart
(1963) for Ottawa sand and quartz sand are also superposed in Figure 8.7, indicating
that their relationships are located near the sands tested here, but quite different from
well-graded gravelly soils not only in void ratio but also in the range of S-wave velocity.
p
0
σ
h
/