Geoscience Reference
In-Depth Information
P
(a)
S
P
(b)
S
0.0
0.1
0.2
0.3
0.4
0.5
Time (sec)
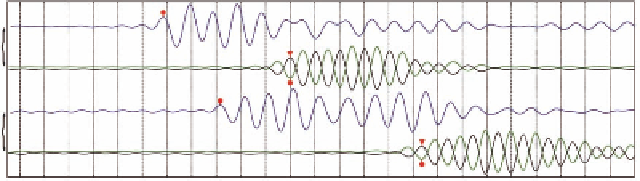
Fig. 7.3. Example compression (P)and shear (S) wave records usingT-Rex as the
downhole seismicsource: (a) receiver at an intermediate depth of 137mand (b) adeep
depth of 290m(fromLi, 2007)
are shown in Figures7.3a and b, respectively. Relative times of the direct P and S wave
oneachwaveformareshowninthefigure.Theserelativepointsweretrackedthroughout
the complete depth range fromwhich V
p
and V
s
profiles were determined.
3. In-situ parametric studies
Field seismic methods are also being developed to permit in-situ evaluation of various
parametersthataffectthedynamicresponseofsoilduringearthquakes.Theseparameters
include: (1) state of stress, (2) strain amplitude in the nonlinear range, and (3) dynamic
loading at strains creating pore pressure generation leading to liquefaction. The methods
involve applying static and dynamic loads near the surface of the soil deposit and mea-
suring the response of the soil mass beneath or around the loaded area using embedded
instrumentation. In all cases, T-Rex (see Figure7.1b) is an excellent source in applying
both static and dynamic loads.
Two field approaches that are used to measure nonlinear shear moduli are shown in
Figure7.4. The first approach (Figure7.4a) utilizes a surface footing that is dynamically
loaded horizontally (Park, 2007). This approach is also used to evaluate the effect on V
s
and V
p
of in-situ changes in stress state as discussed below. The second approach (Fig-
ure7.4b) utilizes a drilled shaft that is dynamically loaded vertically (Kurtulus, 2006).
The third parametric study, involving controlled loading at strain levels that create pore
pressures, is simply an adaptation of the surface-footing arrangement in Figure7.4a.
In this case, the embedded instruments are placed at larger depths below the surface,
with the locations being within the upper portion of the potentially liquefiable soil layer
(Cox, 2006). Briefexamples of each parametric study are presented below.
Example 1 Log
V
s
-Log
σ
o
Relationship.
This example, shown in Figure7.5a, presents
onesetofmeasurementsinwhichthelogV
s
-log
σ
o
relationshipwasdetermined(Stokoe
et al., 2005). A 1.2-m diameter concrete footing was used as the loading platen. The soil
beneath the footing was a poorly graded sand (SP) that was lightly cemented, overcon-
solidated, and unsaturated. Staged loading was performed with increasing static vertical