Geoscience Reference
In-Depth Information
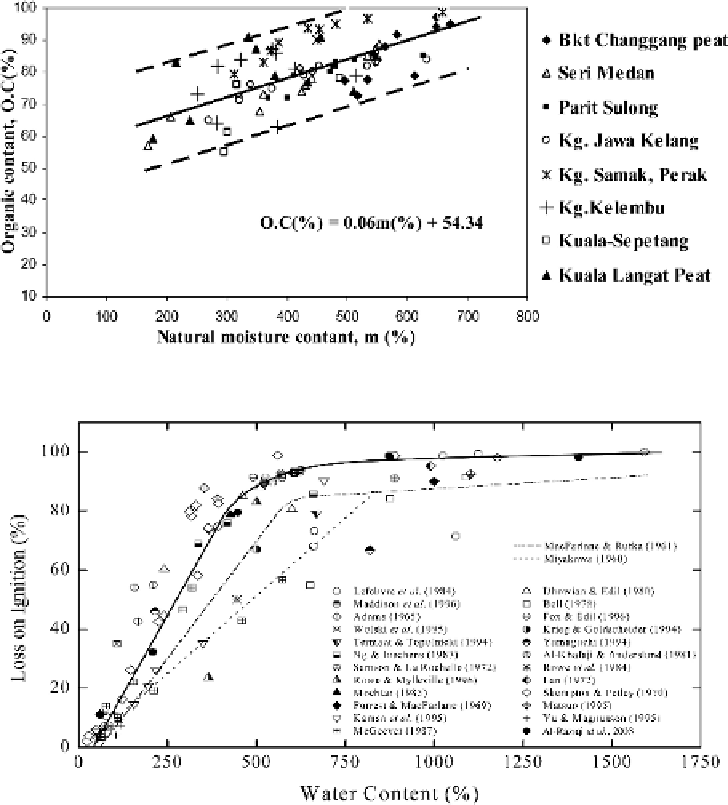
Figure 3.19
Water content vs. organic content (
after
Kazemian
et al
., 2009).
Figure 3.20
Correlation of water content with loss on ignition (
after
O'Loughlin and Lehane, 2003).
3.13.1 Water content vs. organic content
Figure 3.19 is a graph of natural water content (m) versus organic content (OC) of the
tropical hemic peat of West Malaysia. The natural water contents of these soils ranged
from 200 to 700%, with organic content in the range 50 to 95%. The organic content
of the peat increases with increasing natural water content.
Figure 3.20 shows the plot of water content versus loss on ignition (O'Loughlin
and Lehane, 2003) for Irish peat and organic soils. The relationship shown is linear but
only up to loss on ignition
N
80%. A high degree of scatter between loss on ignition
(
N
) and water content (
w
o
) exists for soils with higher organic contents, which they
attributed to the degree of humification of the organic matter.
=