Geoscience Reference
In-Depth Information
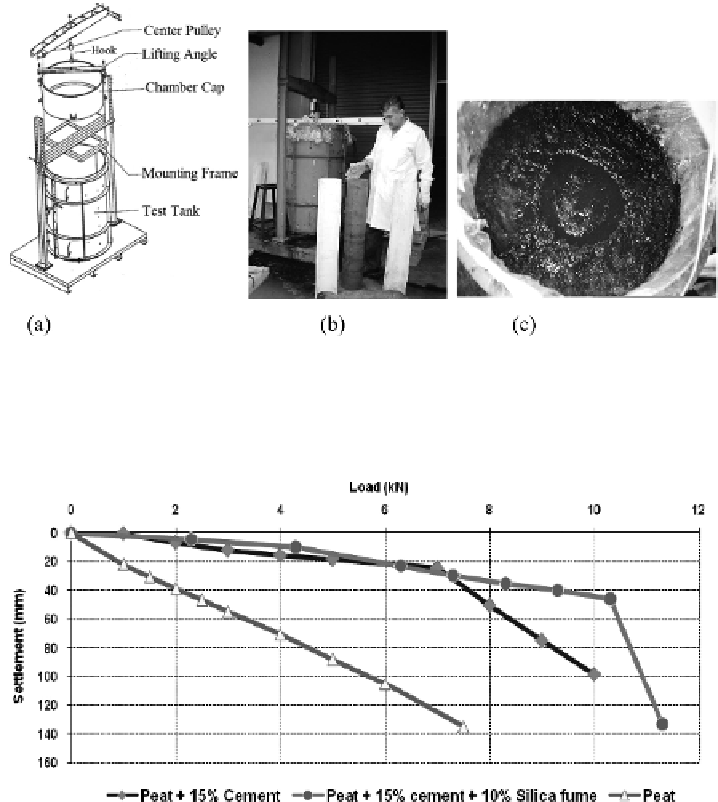
Figure 7.39
Plate load test: (a) schematic diagram of test tank; (b) precast stabilized column; (c) precast
column after being installed in the test tank.
Figure 7.40
Load-displacement curves.
curves for peat and stabilized peat are shown in Figure 7.38(b). The addition of micro
silica to the mixture of peat and cement for the columns also reduced the compression
index.
In order to evaluate the bearing capacity of peat stabilized by precast columns,
plate load tests (PLT) were carried out in a specially designed and fabricated circular
steel test tank (Figure 7.39). The load displacement curves are shown in Figure 7.40.
The authors observed that in the case of peat only, punching failure was observed.
It is obvious that the load-bearing capacity increased with the precast column, and at
the same time there is also a further increase in the bearing capacity with the addition
of silica fume. The use of 10% silica fume as an additive to the column that had 15%