Geoscience Reference
In-Depth Information
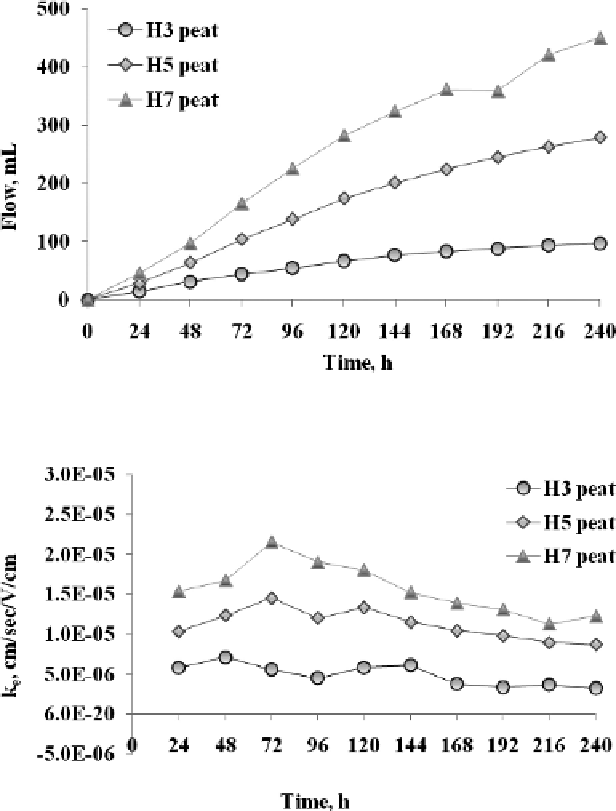
Figure 7.7
Cumulative outflow volume with time (
after
Asadi
et al
., 2011c).
Figure 7.8
Variation of coefficient of electroosmotic permeability with time (
after
Asadi
et al
., 2011c).
3 days and were observed to diminish to a minimum rate after 240 hours (Figure 7.8).
Since the
ζ
of the H7 peat was higher than that of the H3 peat, the amorphous peat
showed a higher
k
e
(Asadi
et al
. 2011c).
The average electroosmotic peat water transport efficiencies (
k
i
) of the H3, H5 and
H7 peats were 2.92
10
−
2
mLA
−
1
s
−
1
, respectively.
k
i
was calculated from the flow rate and current of each peat specimen.
k
i
(net flow per
sec/(average voltage gradient
10
−
2
, 5.32
10
−
2
, and 6.36
×
×
×
cross-sectional area)) is an indicator of the efficiency
of the electroosmotic dewatering. The maximum
k
i
of the H7 peat was higher than
that of H3 and H5. The
k
i
of the peats increased after 2 to 3 days and were observed
to diminish to a minimum rate after 240 hours (Asadi, 2010) (Figure 7.9).
×