Geoscience Reference
In-Depth Information
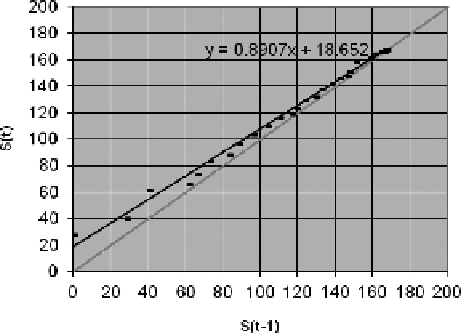
Figure 5.28
Typical Asaoka plot.
Equation (5.10) represents a straight line when the values of
S
n
are plotted on the
vertical axis and values of
S
n
−
1
are plotted on the horizontal axis. Hence
α
represents
the intercept on the vertical axis and
β
the gradient.
A typical straight-line plot that emerges when value of
S
n
−
1
are plotted against
S
n
for a series of equal time intervals is illustrated in Figure 5.28.
From the settlement-time curve in Figure 5.23, when settlement is complete,
S
n
−
1
is the straight line drawn at 45
◦
, i.e.
β
S
n
=
S
n
−
1
. The equilibrium line
S
n
=
=
1.
The ultimate (100%)
settlement,
S
100
,
can be obtained by substituting
S
n
=
S
n
−
1
=
S
100
into Equation (5.10):
S
100
=
a
+
β S
100
and
S
100
=
a/
(1
−
β
)
(5.11)
The 90% settlement
S
90
is thus given by:
S
90
=
0
.
9
a/
(1
−
β
)
(5.12)
The number of time increments
j
90
needed to achieve 90% settlement is given by:
j
90
=
ln (1
−
U
90
)
/
ln
β
(5.13)
The above provides the basis for utilizing settlement data to make assessments of
the degree of settlement that is occurring within the monitored area. Referring to the
straight-line Asaoka plot shown in Figure 5.28, the value
S
100
is obtained when the
best fit straight line through the site data allows increasingly refined predictions of the
magnitude and rate of total settlement to be made.