Geoscience Reference
In-Depth Information
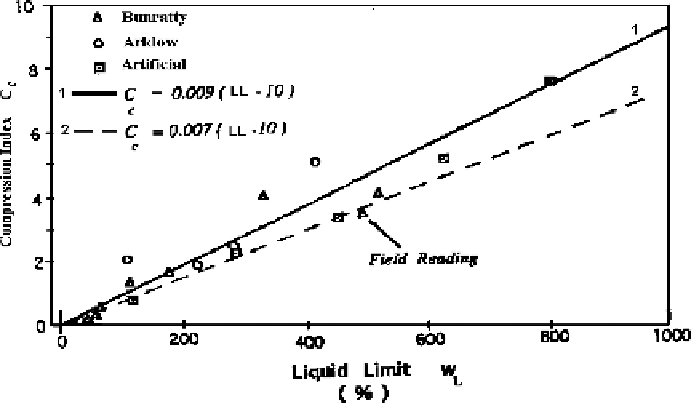
Figure 5.7
Compression index (
c
c
) vs. liquid limit (
LL
)(
after
Farrel
et al.
, 1994).
(Eqn. 5.1) gave a reasonable approximation of this parameter. The plot is shown in
Figure 5.7.
c
c
=
0
.
009(
LL
−
10)
(5.1)
Hobbs (1986) estimated the compression index of temperate (fen) peat to be about
c
c
=
0
.
007(
LL
−
10)
(5.2)
which gives a slightly lower value of
c
c
. Average values of
c
c
for tropical peat, however,
are a little higher than the above two relationships. The
c
c
values for peat can be as
high as 5 to 10 compared with clay of only 0.2 to 0.8.
Azzouz
et al
. (1976) gave the following relationship for organic soil and peat:
c
c
=
0
.
0115
w
(5.3)
where
w
is soil natural water content (%).
Figure 5.8 shows a plot of the initial voids ratio versus liquid limit obtained for
tropical peats fromMalaysia, together with those for normally consolidated peat found
by Miyakawa (1960) and Skempton and Petley (1970). The general trend is that the
void ratio increases with an increase in the liquid limit.
The void ratio of peat ranges from 9 for amorphous peat up to 25 for fibrous peat.
Such high void ratios give rise to phenomenally high water contents. For comparison,
Malaysian marine clay, for instance, has an initial void ratio in the range 1.5 to 2.5.
The natural void ratios of peats indicate their higher capacity for compression.