Geoscience Reference
In-Depth Information
Laboratory simulation of a running displacement [Nosov, Shelkovnikov (1995)]
was performed with the set-up depicted in Fig. 2.17. As the wave source use was
made of three identical ocean bottom wave generators (of length
l
= 0
.
3m) lo-
cated at the centre of the hydrocanal and driven sequentially. The motion of each
of the generators simulated a vertical displacement of the basin bottom, involving
residual displacement, and was controlled by its individual sensor. The amplitude of
motions of the generators did not exceed 2 mm. The duration of motion of each gen-
erator,
l
(g
H
)
−
1
/
2
τ
, was chosen so as to have pulsed displacements:
τ
(usually,
∼
0
.
2 s). The depth of the water in experiments amounted to 3, 5, 7 and 10 cm.
Perturbations of the free water surface were registered with the aid of two IR
wavegraphs, located at the boundaries of the generation area. Records of the gen-
erator motions and of signals arriving from the wavegraphs were used in de-
termining the maximum amplitude of the wave perturbations running along and
against the direction of propagation of the displacement; the vertical displacement
of each of the generators is
η
i
and the propagation velocity of the displacement,
v
=(
l
/
t
12
+
l
/
t
23
)
/
2, where
t
12
and
t
23
are the time intervals between the connec-
tions of the first and second and of the second and third generators.
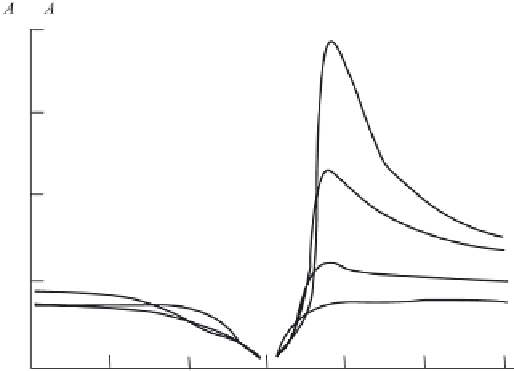
The results of experiments and of calculations, performed in accordance with for-
mula (2.72), are presented in Fig. 2.25 as dependences of the maximum amplitude
of the wave perturbation,
A
max
, upon the propagation velocity of the basin bottom
displacement. The dependence is presented in dimensionless coordinates: the wave
perturbation amplitude is normalized to the amplitude of the bottom displacement,
A
0
=(
η
3
)
/
3, averaged for each given experiment, while the velocity
v
is
normalized to the propagation velocity of long waves,
v
0
=(g
H
)
1
/
2
. The data on
the maximum amplitude of the wave, running against the direction of propagation of
η
1
+
η
2
+
Fig. 2.25 Experimental and calculated dependences of the maximum wave amplitude at the bound-
ary of the generation area at points
x
= 0(
v
/
v
0
<
0) and
x
=
b
(
v
/
v
0
>
0) versus the propagation
velocity of the displacement. Curves 1-4 correspond to values of parameter
b
= 1, 2, 5 and 10