Geoscience Reference
In-Depth Information
(a)
(b)
(c)
(d)
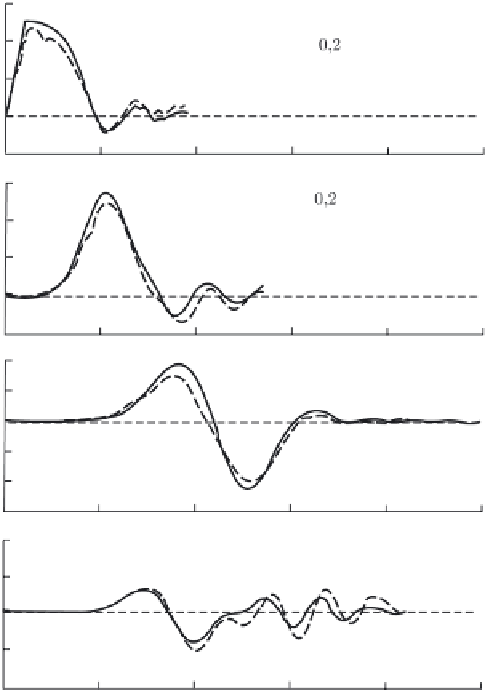
Fig. 2.18 Examples of time evolvents of waves generated by piston-like (a, b) and membrane-
like (c, d) displacements of the basin bottom. Solid line—linear potential theory, dotted line—
experiment;
a
= 0
.
3m,
H
= 0
.
1m
10
−
3
, while the depth and wave length are related as
and the basin depth,
A
/
H
∼
10
−
2
-10
−
1
. It is extremely difficult to establish such relationships in labo-
ratory conditions. Owing to application of the IR wavegraph we have succeeded to
perform the first investigation in the case of realistic relationships between the basin
depth, wave length and amplitude.
Figure 2.18 presents examples of waves, registered in the experiment (dotted
line) and calculated in accordance with linear potential theory (solid line). The
theory is seen to describe the wave perturbations quite adequately. Explanation of
the small discrepancy between experiment and theory consists in that the actual time
dependences of the basin motion differed insignificantly from the theoretical depen-
dences, the first time derivatives of which exhibit discontinuities. The experimen-
tal points shown in Figs. 2.12-2.14 were obtained as a result of analysing several
H
/
λ
∼