Geoscience Reference
In-Depth Information
(cm
2
s
−1
)
(cm)
(cm)
(cm)
(cm)
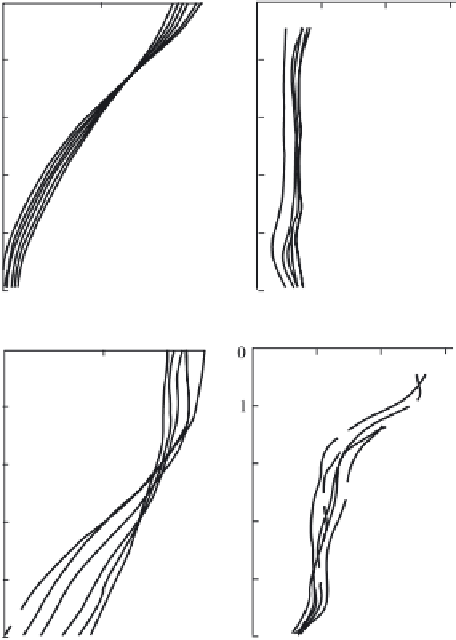
Fig. 7.18 Examples of successively registered (with an interval of 56 s) vertical temperature pro-
files (curves 1-6) and of respectively calculated profiles of the vertical turbulent exchange coeffi-
cient (curves 1-5)
the quantity
K
(7) assumes values close to the molecular value. Then, an increase
of this parameter, in certain cases quite significant, is observed, which is related to
the collapse of waves: at frequencies of the order of 10 Hz the amplitude of waves
in the structures could amount to 3-5 cm, i.e. a value comparable to the depth of
the liquid. Finally, further enhancement of the acceleration amplitude, in the region
of
a
g, is accompanied by a sharp increase of
K
(7) values.
Here it must by noted that large values of the turbulent exchange coefficient are
achieved at large amplitudes of bottom oscillations. Of interest, also, is the fact that
K
(7) values can exceed the molecular temperature conductivity coefficient by more
than three orders of magnitude.
The results obtained with a model system can, naturally, not be applied straight-
forwardly to a real ocean. At any rate, they permit to reveal the general character
of processes that can take place in natural conditions. From this point of view,
∼