Geoscience Reference
In-Depth Information
m
2
s
−3
m
2
s
−3
(s)
(s)
0.0001 m
2
s
−3
(s)
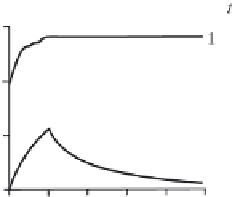
Fig. 7.7 Typical time dependences, describing variation of the maximum temperature gradient
(1), of the turbulence energy averaged over depth (2), of the surface temperature (3), of the centre-
of-mass position (4). Calculations are performed for
L
= 10 m,
t
= 100 s and different
β
0
values
(shown in the figure)
grad
T
(
z
,
t
)
max
0
<
z
<
H
grad
T
(
z
,
0)
−
1
,
f
1
(
t
)= max
0
<
z
<
H
H
)
−
1
f
2
(
t
)=(
H
β
0
τ
b
(
z
,
t
) d
z
0
⎛
⎞
−
1
H
f
3
(
t
)=
T
(0
,
t
)
T
(0
,
0)
⎝
H
−
1
⎠
−
T
(
z
,
0) d
z
−
T
(0
,
0)
,
0
z
cm
(0))
−
1
,
f
4
(
t
)=(
z
cm
(
t
)
−
z
cm
(0)) (0
.
5
H
−
where
⎛
⎞
−
1
H
H
⎝
⎠
z
cm
(
t
)=
z
ρ
(
z
,
t
) d
z
ρ
(
z
,
t
) d
z
.
0
0
The maximum gradient is normalized to its value at the initial moment of time.
The turbulence energy averaged over the depth is normalized to the total energy
arriving in time
per unit mass. The changes in surface temperature and centre-of-
mass position are normalized to their maximum possible values, which are achieved,
when the water is mixed until its state is completely uniform.
τ