Geoscience Reference
In-Depth Information
(m
2
s
−2
)
T
8
C
(m)
(m)
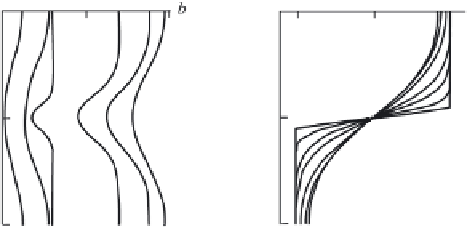
Fig. 7.5 Vertical profiles of temperature and of turbulence energy, calculated at successive mo-
ments of time for
L
= 10 m,
β
0
= 0
.
003 m
2
s
−
3
and
τ
= 100 s. Curves 1-7 correspond to
t
= 0
,
10
,
30
,
50
,
100
,
150 and 200 s
.
.
T
8
C
(m
2
s
−2
)
(m)
(m)
Fig. 7.6 Vertical profiles of turbulence energy and of temperature, calculated at successive
time moments for
L
= 10 m,
0
= 0
.
0001 m
2
s
−
3
β
and
τ
= 100 s. Curves 1-7 correspond to
t
= 0
,
50
,
100
,
150
,
200
,
250 and 300 s
In both cases, after pumping is switched off, the energy of turbulence pulsations
and, consequently, the exchange coefficient in the region of the jump in temperature
rapidly decrease, practically down to zero. However, above and below the region of
the jump in density turbulence pulsations still persist for some time (up to 1,000 s),
thus influencing the temperature profile.
A phenomenon, similar to the second scenario takes place, when a thin verti-
cal structure of hydrodynamic fields forms in the ocean. In the non-linear system
considered one observes the most simple, and at the same time typical, case of
self-organization: the energy flux brought to the system leads to its stucturization in
space (enhancement of the gradient).
Figure 7.7 presents typical dependences, describing variation in time of the max-
imum temperature gradient
f
1
(
t
), the energy of turbulence pulsations averaged over
depth, the surface temperature
f
3
(
t
) and the centre-of-mass position
f
4
(
t
):