Geoscience Reference
In-Depth Information
Ea
tres
Ro
Is
Is
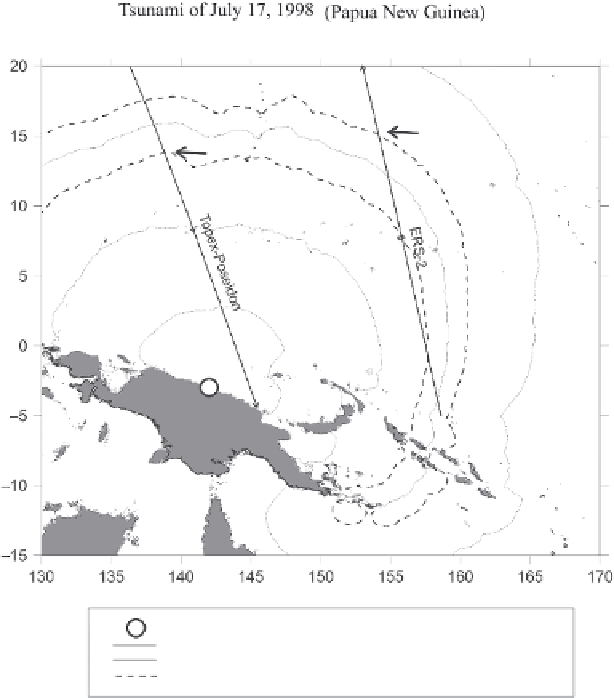
Fig. 6.12 Map of Pacific Ocean region adjacent to the island Papua New Guinea with isolines
of arrival times of the 1998 tsunami (in 1 h steps). Shown are the routes of the satellites Topex-
Poseidon (circuit 215-18) and ERS-2 (circuit 34-304), which intersect the tsunami wave front. The
crossing points of the routes and the respective isolines of the tsunami front arrival times (dashed
line) are indicated by arrows (The figure is taken from [Zaichenko et al. (2004)])
level, measured by the altimeter. In Fig. 6.15b (see colour section) the profile is de-
picted in an enhanced scale. For comparison, the level profile, obtained 10 days
before the tsunami (preceding cycle 108), is also plotted. The time it took the satel-
lite to cross the Indian Ocean corresponds to the period between 2 h 51 min (12
◦
of
southern latitude) and 3 h 02 min (20
◦
of northern latitude), i.e. approximately 2 h
after formation of the tsunami wave. The wave front is seen well at approximately
6
◦
of southern latitude. The maximum wave amplitude amounts to 80 cm.
From Fig. 6.14 the intersection angle of the satellite's route and the wave front
is seen to be approximately 45
◦
. Therefore, the real horizontal scales of ocean-level
variations must be (for geometrical reasons) divided by 1.4. The main wave length in