Geoscience Reference
In-Depth Information
(min)
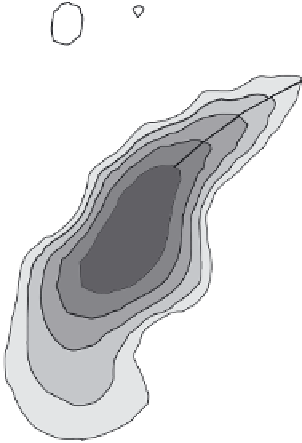
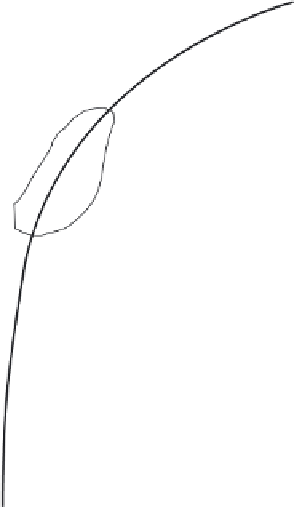
Fig. 5.2 Spectral-time diagram for amplitude of ocean-level oscillations during passage of tsunami
of March 6, 1988, tsunami (the record is shown in Fig. 5.1). The isolines are drawn steps of 1 dB.
The solid line shows theoretical calculation of time spectral components take effect, performed
in accordance with the dispersion law for gravitational waves (Adapted from [Kulikov, Gonzalez
(1995)])
Manifestations of tsunami wave dispersion have also been observed during anal-
ysis of the space structure of ocean level oscillations using the data of satellite al-
timetry (tsunami of December 26, 2004). These data are presented in Sect. 6.3.
We shall now estimate the distance, at which manifestations of dispersion effects
should turn out to be quite significant. We shall take advantage of the dispersion
relation for gravitational surface waves in a liquid,
2
= g
k
tanh(
kH
), according to
which the group velocity is determined by the formula
ω
g
kH
cosh
2
(
kH
)
+ tanh(
kH
)
2
g
k
tanh(
kH
)
C
gr
=
∂ω
∂
=
.
k
The distance of dispersive destruction of a wave,
L
cd
, can be determined as
the product of the velocity of long waves by the time, required for a wave packet to
lag behind the front at a distance equal to the wavelength [Kulikov et al. (1996)],