Geoscience Reference
In-Depth Information
(a)
(b)
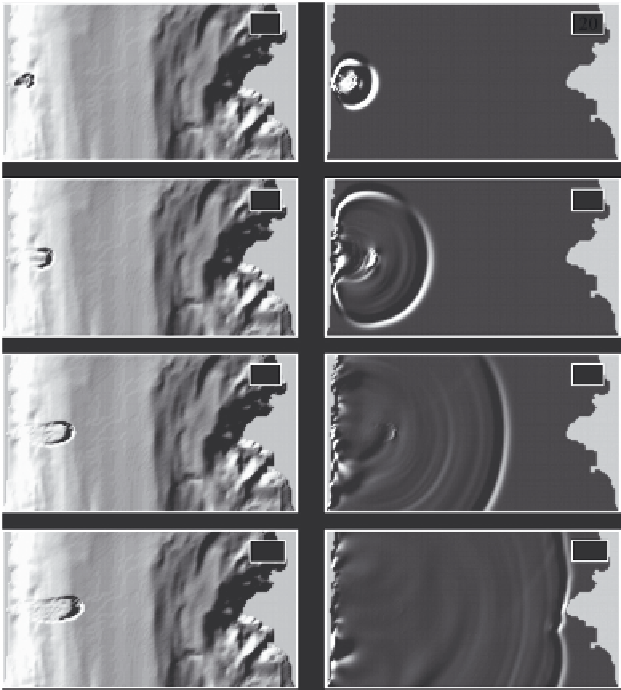
Fig. 4.3 Results of numerical simulation of the movement of a landslide on the bottom of
Malaspina strait (a) and of the resultant surface waves (b) for times 20, 50, 90 and 132 s after
the landslide collapses. Adapted from [Rabinovich et al. (2003)]
reaches Cape Cockburn on Nelson island in approximately 132 s after the slilde
starts moving. As a result, reflected waves form, and the general picture of rough-
ness in the Malaspina strait becomes complex, reminding standing oscillations. The
waves leaving through the open boundaries of the strait leads to rapid dampening of
the amplitudes of level oscillations.
Figure 4.4 presents examples of calculations of level variations at points A, B and
C, the locations of which are indicated in Fig. 4.2. The maximum wave amplitude
is observed at site A, the closest to the landslide zone, and the minimum amplitude
turns out to be in the middle of the strait (point B). The tsunami starts with negative
phase at point A and positive phase at points B and C.
The amplitude distributions of a tsunami wave at its crest and its depression along
the west and east coasts of the strait are shown in Fig. 4.5. According to these calcu-
lations the maximum level reduction (down to
−
5 m) is observed in the immediate