Geoscience Reference
In-Depth Information
From Figures 3.14a and 3.15a it is well seen that the most significant variations
of pressure are observed during 10-15 min after the beginning of the earthquake.
Therefore, in performing spectral analysis, we only dealt with lengths of time series
amounting to 1,000 s. Before calculating a spectrum, the time series was reduced
to the zeroth level by subtraction of the linear trend. It is readily shown that only
the minimal normal frequency of elastic oscillations of the water column,
ν
0
, can
be observed in the spectra; all the other normal frequencies lie above the Nyquist
frequency, equal to 0.5 Hz.
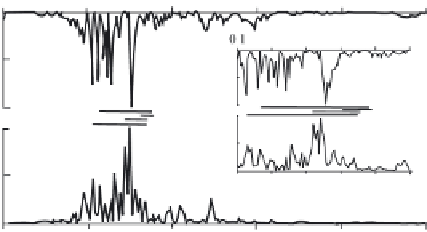
The frequency spectra of pressure variations, normalized to the maximum value,
are presented in Fig. 3.16. The non-standard position of the upper plot permits to
compare the locations of the principal maxima of the spectra, without overloading
the figure. The 0.1-0.2 Hz frequency range is shown in detail in the inset.
From Fig. 3.16 it is seen that the energy of elastic oscillations is mostly concen-
trated within the 0.05-0.4 Hz interval. Both spectra exhibit clear main maxima. The
spectrum corresponding to sensor PG1 has a maximum (resolved as several approx-
imately equal peaks) in the 0.14-0.15 Hz range. The main maximum for sensor PG2
lies in the 0.15-0.16 Hz.
We stress that the positions of the maxima are different along the frequency scale.
This is in favour of the assumption that the main maxima are not related to the spec-
tral characteristics of the seismic source, but to the resonance response of the com-
pressible water column at the minimal normal frequency. Sensor PG1 is situated in
a deeper place, so a lower normal frequency corresponds to it.
For performing accurate calculation of the normal frequency
ν
0
, information is
necessary on the speed of sound (in the vertical profile) and the ocean depth at
the given point. The depths of the ocean at the points, where the sensors were estab-
lished, were determined by linear interpolation from the 2-min global database of
the Earth's relief (ETOPO2, http://www.ngdc.noaa.gov/). The information on the lo-
cation of the sensors, presented above, was taken from the official network page
Frequency (Hz)
Frequency (Hz)
Fig. 3.16 Normalized spectra of near-bottom pressure variations, registered by sensors PG1
(lower) and PG2 (upper). Horizontal lines show the ranges of positions of the minimal normal
frequency of elastic oscillations, calculated without account (thin lines) and with account (thick
lines) of the sedimentary layer. The inset shows the 0.1-0.2 Hz frequency interval in detail