Geoscience Reference
In-Depth Information
greening-up dates are affected strongly by snow effects infl uencing the spectral sig-
natures in the red and near-infrared bands. This means that NDVI time-series based
methods cannot be used to determine the onset of the greening-up of the vegetation
alone, but instead indicates the timing of the snow melt, when the NDVI signature
increases in spring. In contrast to NDVI, the normalised difference water index
(NDWI) only showed a small snow effect. The estimated dates of leaf colouring in
autumn show a lesser accuracy than the greening-up dates (Delbart et al., 2005).
Delbart et al. (2006) report an average advance of spring greening-up over Siberia
of 3.5 days between 1982 and 2004. This trend varies spatially across regions and
temporally: From 1982 to 1991, the start of the greening-up advanced by 7.8 days,
but between 1991 and 1999, only random variation is observed while from 2000
to 2004, there was a trend towards a later greening-up by as much as 7 days (Delbart
et al., 2006). Similar observations were made from an analysis of fAPAR time-series
data (fraction of absorbed photosynthetically active radiation) over Siberia by
Balzter et al. (2007c) illustrated in fi gures 19.5 and 19.6.
Analysis of NDVI-derived biophysical parameters from 1981 to 1991 indicated
a greening trend and an increase in growing season length in the Northern Hemi-
sphere (Myneni et al., 1997) that was attributed to a biosphere response to climate
change. After the Mount Pinatubo volcanic eruption in June 1991, a drop in NDVI
was observed that was probably caused by reduced vegetation photosynthetic activ-
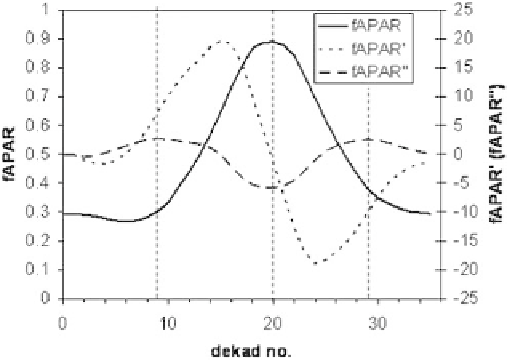
Figure 19.5
Illustration of the phenological signal in the second order slope of the
FASIR fAPAR time series data for one pixel location (pixel 74, line 253; 57.03ºN 95.01ºE)
and one year (1995). Left
y
axis: fAPAR; right
y
axis: fi rst and second local derivatives
of fAPAR. The typical 'camel back' appearance of peak, trough, and second peak in
the second order derivative (dashed line) corresponds to the start, peak, and end of
growing season indicators shown as vertical broken lines, which are determined based
on the local maxima and minimum of the local second derivative. Reprinted from
Balzter, H., Gerard, F., Weedon, G., Grey, W., Combal, B., Bartholomé, E., Bartalev, S.
and Los, S. (2007c) Coupling of vegetation growing season anomalies with hemispheric
and regional scale climate patterns in Central and East Siberia.
Journal of Climate
,
20(15), 3713-29, doi: 10.1175/JCLI4226. (C) Copyright 2008 American Meteorological
Society (AMS).