Geoscience Reference
In-Depth Information
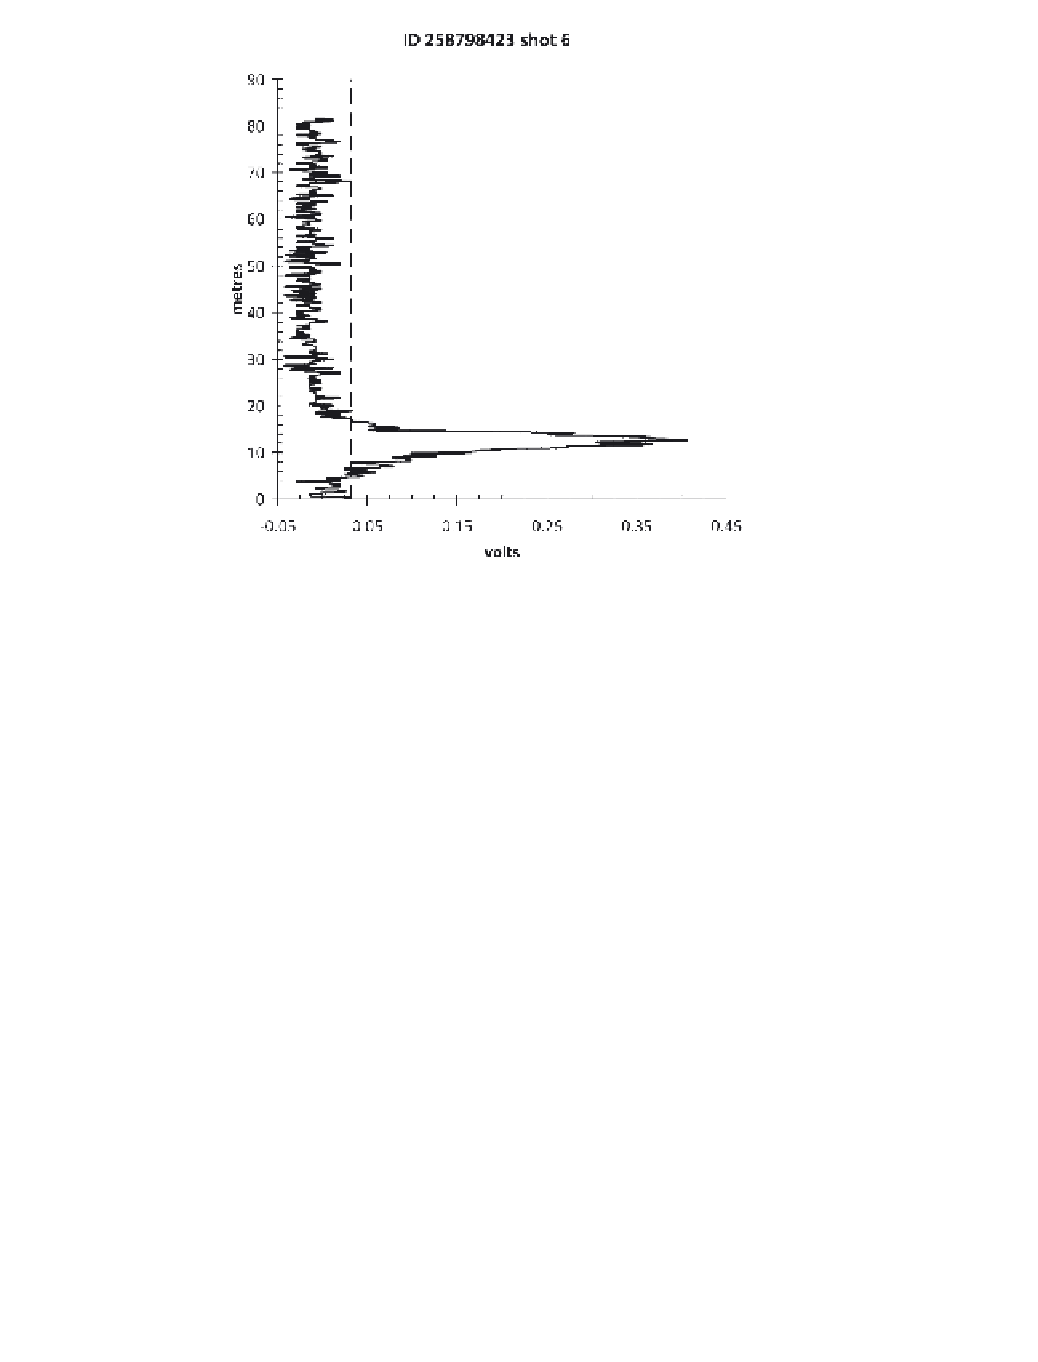
Figure 19.3
Full waveform of an ICESAT-GLAS footprint (cloud-free acquisition) in
Siberia. The full waveform can be used to derive forest canopy structure and terrain
height. The intensity (volts) indicates from which height in the footprint most of the
relfected radiation originated. The relative travelling time of the pulse is a measure
of height. The thickness of the vegetation canopy can be determined by fi nding the
maximum and minimum height values that exceeded the noise level (vertical dashed
line), in this example 17 m-5 m
12 m, which was verifi ed from forest inventory data.
Acknowledgement: Claire Burwell (University of Leicester) GLAS data from Zwally, H.
J., Schutz, R., Bentley, C., Bufton, J., Herring, T., Minster, J., Spinhirne, J., and Thomas,
R. (2006)
GLAS/ICESAT L1A Global Altimetry Data V028
. Boulder, CO: National Snow
and Ice Data Center. Digital media
=
partially penetrate through vegetation tissue, SAR can measure vegetation volume
and structure in three dimensions. Three basic approaches of biomass mapping from
SAR can be distinguished: backscatter, coherence and phase-based approaches.
Radar backscatter
is the energy that is received by the SAR sensor after being scat-
tered by the imaged target area. As described above, radar backscatter from forests
originates from three basic physical scattering mechanisms: volume scattering within
the canopy, rough surface scattering from the ground and double-bounce scattering
from trunk-ground interactions. Backscatter intensity has been used to estimate
woody biomass of forest (Kasischke et al., 1997), forest biomass (Le Toan et al.,
1992), forest aboveground dry biomass (Rignot et al., 1994) and timber volume
(Balzter et al., 2002a). Forests with higher biomass generally show higher backscat-
ter, but the biomass-backscatter relationship saturates at a wavelength-dependent
biomass level. This saturation problem restricts SAR applications for biomass